Article
Ruble and MICEX index answered in their own way on the Russia’s junk rating made by S&P and Moody’s

In February, after the longstanding fall, the average monthly official ruble exchange rate for the first time since the last summer strengthened by 1% to average monthly January rate, to euro by 2,7%.

In 2014 there was a rapid devaluation of ruble. Following the results of the year the annual average exchange rate (38,6 RUB for 1 USD) exceeded the indicator of 2013 by 21% (31,9 RUB for 1 USD). The ultimate negative trend was registered in November, December 2014 and in January 2015 when the ruble depreciated by 13,3%, 20,7% and 16,8% correspondingly.

The same situation happened concerning euro when the annual average exchange rate of ruble “lost ground” to European currency by 20,3% (42,4 RUB for 1 EUR in 2013, 51 RUB for 1 EUR in 2014).

ruble exchange rate

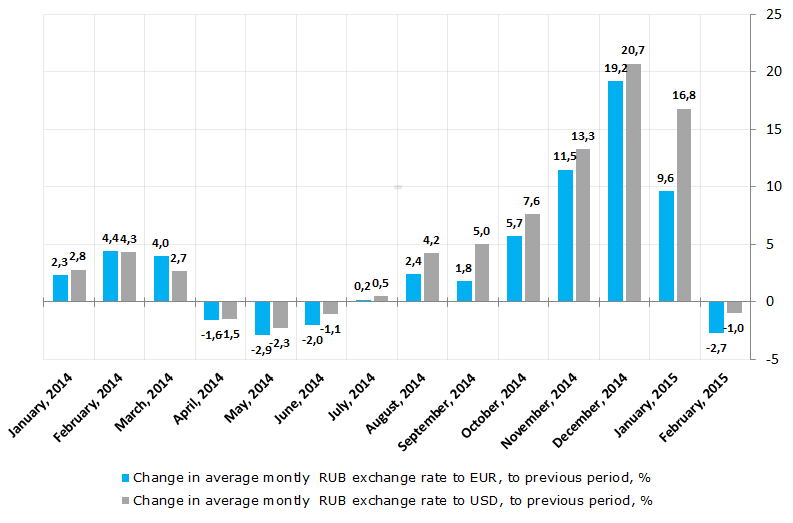
Figure. Change in average monthly official USD and EUR rates to previous period, %

In February 2015 we observe the refraction of the negative trend, when the ruble for the first time since June 2014 has strengthened. It happens against the background of improvement of world oil price environment and certain stabilization of situation in Ukraine after the Minsk Protocol.

Further situation concerning the ruble exchange rate will mostly depend on stability of ascending trend of raw material price. Sanctions of the Western countries and lowering of rated by international rating agencies play a small part.

Table. Dynamics of the average monthly exchange rate, set by the Central Bank of Russia
DateAverage montly official exchange rate of the Central Bank, RUB for 1 USDChange to previous period, %Average official exchange rate of the Central Bank, RUB for 1 EURChange to previous period, %
January, 2014 33,8 2,8 46,1 2,3
February, 2014 35,2 4,3 48,1 4,4
March, 2014 36,2 2,7 50,0 4,0
April, 2014 35,7 -1,5 49,2 -1,6
May, 2014 34,8 -2,3 47,8 -2,9
June, 2014 34,4 -1,1 46,9 -2,0
July, 2014 34,6 0,5 47,0 0,2
August, 2014 36,1 4,2 48,1 2,4
September, 2014 37,9 5,0 49,0 1,8
October, 2014 40,8 7,6 51,8 5,7
November, 2014 46,2 13,3 57,7 11,5
December, 2014 55,8 20,7 68,8 19,2
January, 2015 65,2 16,8 75,3 9,6
February, 2015 64,5 -1,0 73,3 -2,7

The good news also comes from the market. Thus in February the MICEX index achieved 1837 points on closing. This figure became the maximum since April 2011. Due to this, displacement of news matters pleases. If earlier the market trembled after any negative decision of such agencies as S&P and Moody’s, which lowered sovereign investment rating of Russia to a junk one in January and February, or after overseas politicians’ statements concerning worsening of country’s investment climate, today such news go unnoticed and just leave the negative mood. This situation can be explained by political partiality of such characteristics, which in some cases doesn’t correspond to real economic climate, national debt rate and dynamics of industrial production.   

Ranking
Return on investment of special clothing manufacturers

Information agency Credinform prepared a ranking of Russian special clothing manufacturers. The companies with the mentioned activity type and the highest volume of revenue were selected for this ranking according to the data from the Statistical Register for the latest available period (for the year 2013). The enterprises of the first top 10 were ranked by decrease in return on investment ratio.

Return on investment is the index of efficiency of equity capital involved in commercial activity and long-term funds raised. It is calculated as a ratio between net profit and the sum of equity capital and long-term liabilities.

As known, there is no standard value for profitability ratio due to its high dependency on the industry, in which the company acts. That is why each specific company should be accounted in comparison with industry-specific indexes.

Return on investment and solvency index of special clothing manufacturers with the highest turnover, Top-10
Name, INNRegionTurnover 2013, mln. RUBReturn on investment, (%)Solvency index Globas -i®
1 ООО Rus-Andro
ИНН 7706294490
Moscow 1589 114,99 210 (high)
2 BTC GROUP JOINT-STOCK COMPANY
ИНН 7816043890
Saint-Petersburg 21 419 77,61 200 (high)
3 Nadezhda JOINT-STOCK COMPANY
ИНН 5226000322
Nizhniy Novgorod region 845 58,85 226 (high)
4 CJSC Kombinat rabochey odezhdy
ИНН 274043510
The Republic of Bashkortostan 1399 53,53 141 (the highest)
5 PV OOO FIRMA TECHHNOAVIA
ИНН 7724152603
Moscow 8091 28,87 163 (the highest)
6 CJSC MERIDIAN
ИНН 5259003336
Nizhniy Novgorod region 1340 26,91 168 (the highest)
7 ООО Red Fox
ИНН 7825387961
Saint-Petersburg 992 15,24 218 (high)
8 CJSC FPG Energokontrakt
ИНН 7703268269
Moscow 4198 12,48 193 (the highest)
9 ООО Kompaniya Splav
ИНН 7720019512
Moscow 1500 8,94 187 (the highest)
10 PTK Moderam JOINT-STOCK COMPANY
ИНН 7816057195
Saint-Petersburg 1329 3,18 233 (high)

For a long time the only requirements to special clothing were utility and comfort. Special clothing is supposed to be created for workers, that is why fashion trends have always passed this industry by. Nowadays the situation with the uniform is quite different. Many types of special clothing have appeared, such as working clothes, corporate clothes, clothes for service workers, medical wear.

Such broad variety has provoked an interest of many designers to special clothing and made companies’ executives find possibilities to stand out on the market; these undoubtedly improved the development of the industry. Total turnover of domestic special clothing manufacturers at year-end 2013 exceeded 42 bln. RUB, having increased by 76% against 2012.

The first top-3 of the ranking is represented by ООО Rus-Andro (return on investment value is 114,99%), BTC GROUP JOINT-STOCK COMPANY (77,61%) and Nadezhda JOINT-STOCK COMPANY (58,85%). These enterprises showed extremely high values, indicating an efficient use of funds raised. All companies of the top-3 has got high solvency index Globas -i® and this is a feature of financial stability.

clothing manufacturers russia

Return on investment of major special clothing manufacturers in Russia, Top-10


PTK Moderam JOINT-STOCK COMPANY with return on investment value of 3,18% closes the ranking. This value is significantly lower than the key competitors have. However the company has got high solvency index Globas-i® due to the complex of financial and non-financial indexes.

In conclusion it should be added that the importance of return on investment index is not only in return on involved funds. Using this index it is possible to assess reasonability of borrowing funds at certain interest. The company should take loans at interest lower than investment capital profitability.