Trends in business management
Information agency Credinform has prepared a review of trends in activity of the companies engaged in head office management. The largest companies (TOP-1000) in terms of annual revenue were selected according to the data from the Statistical Register and the Federal Tax Service for the latest available periods (2011 – 2020). The company selection and analysis were based on data of the Information and Analytical system Globas.
Net assets is a ratio reflecting the real value of company's property. It is calculated annually as the difference between assets on the enterprise balance and its debt obligations. The ratio is considered negative (insufficiency of property), if company’s debt exceeds the value of its property.
The largest company in terms of net assets is JSC ROSNEFTEGAZ, INN 7705630445, Moscow, holding companies management activities. In 2020 net assets of the company amounted to more than 3,3 trillion RUB.
The smallest size of net assets in TOP-1000 had LLC CORPORATE MANAGEMENT COMPANY, INN 2130001337, Chuvash Republic, financial industrial group management activities. The lack of property of the company in 2020 was expressed in negative terms -110 billion RUB.
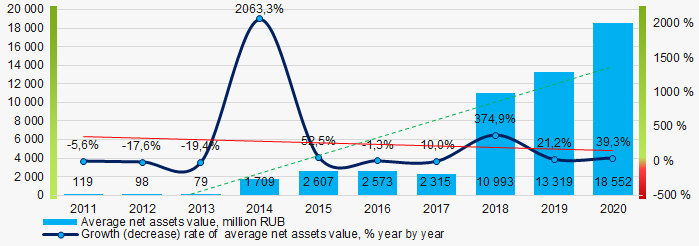
For the last ten years, the average industry values of net assets showed the upward tendency with negative dynamics of growth rates (Picture 1).
 Picture 1. Change in average net assets value in 2011 – 2020
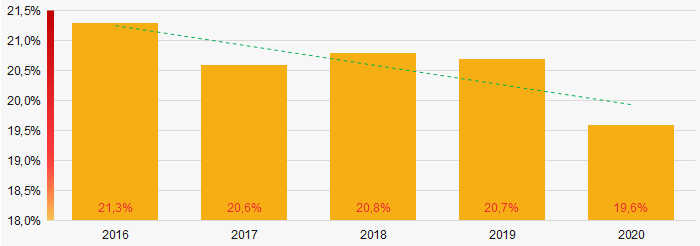
For the last five years, the share of ТОP-1000 enterprises with lack of property was relatively high with the positive decreasing trend (Picture 2).
 Picture 2. The share of enterprises with negative net assets value in ТОP-1000 in 2016-2020
Sales revenue
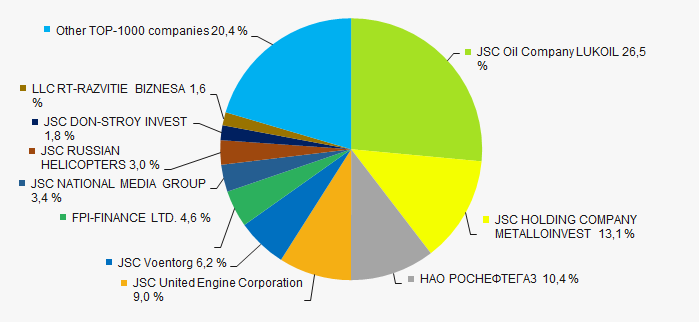
In 2020, the total revenue of 3 largest companies amounted to 50% from ТОP-1000 total revenue (Picture 3). This fact testifies the relatively high level of capital concentration among this type of activities.
 Picture 3. Shares of TOP-10 in TOP-1000 total revenue for 2020
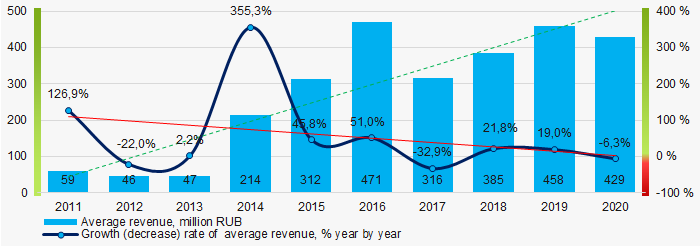
In general, the increasing trend in sales revenue with downward dynamics of growth rates is observed (Picture 4).
 Picture 4. Change in average revenue in 2011 – 2020
Profit and loss
The largest company in terms of net profit is JSC Oil Company LUKOIL, INN 7708004767, Moscow, holding companies management activities. The company’s profit amounted to almost 198 billion RUB.
For the last ten years, the average profit values show the increasing tendency (Picture 5).
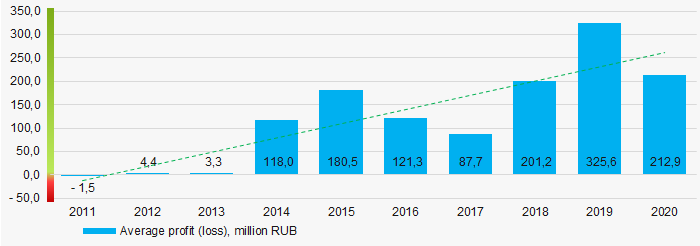 Picture 5. Change in average profit (loss) in 2011 – 2020
Over a five-year period, the average net profit values of ТОP-1000 show the growing tendency, along with this the average net loss is decreasing (Picture 6).
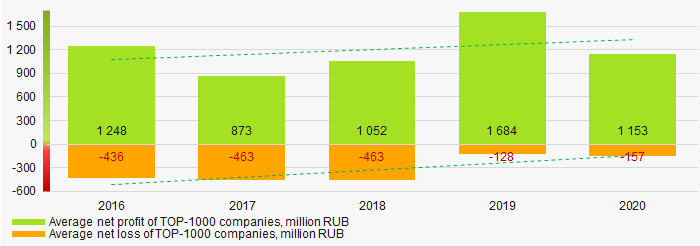 Picture 6. Change in average net profit/loss of ТОP-1000 companies in 2016 – 2020
Main financial ratios
For the last ten years, the average values of the current liquidity ratio were within the recommended values - from 1,0 to 2,0, with growing trend (Picture 7).
The current liquidity ratio (ratio of total working capital to short-term liabilities) shows the sufficiency of company’s assets to meet short-term obligations.
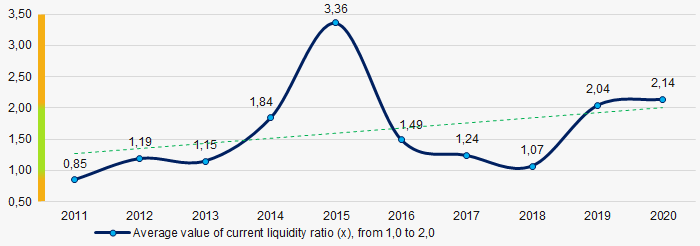 Picture 7. Change in average values of current liquidity ratio in 2011 - 2020
Within ten years, the decreasing trend of the average values of ROI ratio is observed (Picture 8).
The ROI ratio is calculated as a ratio of net profit to sum of stockholder equity and long-term liabilities and shows the return from equity involved in commercial activities and long-term borrowed funds.
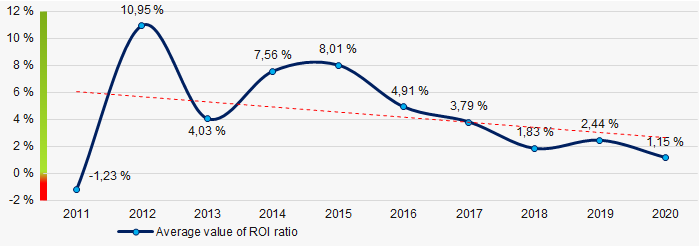 Picture 8. Change in average values of ROI ratio in 2011 – 2020
Assets turnover ratio is the ratio of sales revenue and company’s average total assets for a period. It characterizes the effectiveness of using of all available resources, regardless the source of their attraction. The ratio shows how many times per year the full cycle of production and circulation is performed, generating the corresponding effect in the form of profit.
For the last ten years, this business activity ratio demonstrated the decreasing trend (Picture 9).
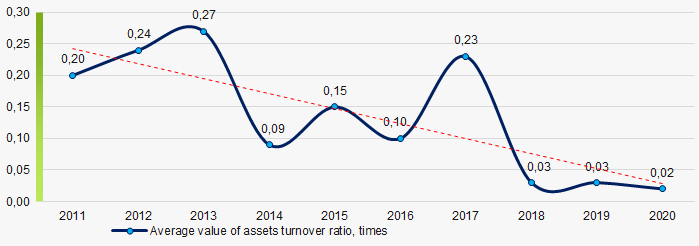 Picture 9. Change in average values of assets turnover ratio in 2011 – 2020
Small businesses
74% of ТОP-1000 companies are registered in the Unified register of small and medium-sized enterprises of the Russian Federal Tax Service. Herein, their share in TOP-1000 total revenue is only 3%, which is significantly lower than the national average value in 2018 – 2019 (Picture 10).
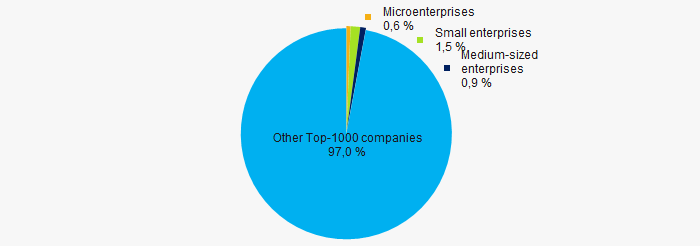 Picture 10. Shares of small and medium-sized enterprises in ТОP-1000
Main regions of activity
TOP-1000 companies are registered in 68 regions of Russia (this is 80% of territorial subjects of the Russian Federation) and are unequally located across the country. Almost 86% of the largest enterprises in terms of revenue are located Moscow (Picture 11).
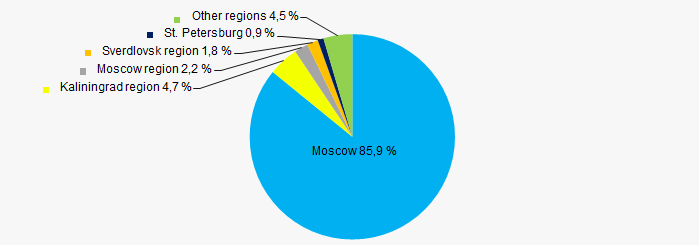 Picture 11. Distribution of TOP-1000 revenue by the regions of Russia
Financial position score
An assessment of the financial position of TOP-1000 companies shows that the largest part has the above average financial position (Picture 12).
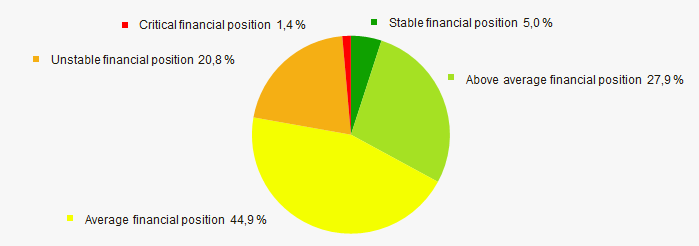 Picture 12. Distribution of TOP-1000 companies by financial position score
Solvency index Globas
Most of TOP-1000 companies got superior/high and strong/medium Solvency index Globas, this fact shows the ability of the companies to meet their obligations in time and fully (Picture 13).
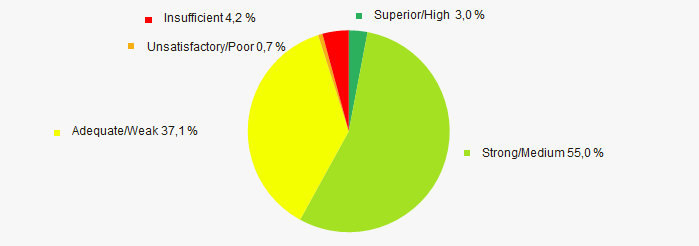 Picture 13. Distribution of TOP-1000 companies by Solvency index Globas
Conclusion
A complex assessment of the companies engaged in head office management demonstrates the presence of positive trends within 2011-2020 (Table 1).
| Trends and assessment factors | Relative share, % |
| Dynamics of average net assets value |  10 10 |
| Growth/drawdown rate of average net assets value |  -10 -10 |
| Increase / decrease in the share of enterprises with negative net assets |  5 5 |
| The level of monopolization / competition |  -10 -10 |
| Dynamics of average revenue |  10 10 |
| Growth/drawdown rate of average revenue |  -10 -10 |
| Dynamics of average profit (loss) |  10 10 |
| Growth/drawdown rate of average net profit |  10 10 |
| Growth/drawdown rate of average net loss |  10 10 |
| Increase / decrease in average values of current liquidity ratio |  10 10 |
| Increase / decrease in average values of ROI ratio |  -10 -10 |
| Increase / decrease in average values of assets turnover ratio, times |  -10 -10 |
| Share of small and medium-sized businesses by revenue more than 20% |  -10 -10 |
| Regional concentration |  -10 -10 |
| Financial position (the largest share) |  5 5 |
| Solvency index Globas (the largest share) |  10 10 |
| Average value of factors |  0,6 0,6 |
 favorable trend (factor),
  unfavorable trend (factor)
Changes in legislation
The Instruction of the Central Bank of Russia as of 11.05.2021 №5791-I updated the requirements to content and format of the requests for the credit history report, search rules of credit history bureau (CHB), information on credit history subjects and affirmation statement of consent availability of credit history subjects.
In particular, the requests addressed to CHB should have the XML format.
CHB should search for the information on the credit history subjects, comparing the data sets from requests and title parts of credit histories of the credit history subjects. A credit report is delivered to the users of credit histories, if there is a match of at least one data set from the request and title part of the credit history in relation to the only one credit history subject.
Content of data included in the request, data sets for search of the information on the credit history subjects and affirmation statement of consent availability of credit history subjects are provided in the appendices to the Instruction.
The updated requirements will come into force since January 1st, 2022.
According to the data of the Central Bank of Russia as of 06.08.2021, the data on 8 enterprises is contained in the State register of credit history bureaus. Users of the Information and Analytical system Globas can get the all the available information on them.