
Order a report
Custom-made industry research, company ratings, competitor analysis


Trends in production of industrial explosives
Information agency Credinform has prepared a review of activity trends of the largest Russian manufacturers of industrial explosives. The largest companies (ТОP-50) in terms of annual revenue were selected according to the data from the Statistical Register and the Federal Tax Service for the latest available periods (2014 - 2019). The analysis was based on data of the Information and Analytical system Globas.
Net assets is a ratio reflecting the real value of company's property. It is calculated annually as the difference between assets on the enterprise balance and its debt obligations. The ratio is considered negative (insufficiency of property), if company’s debt exceeds the value of its property.
The largest company in terms of net assets is LLC UEE - Siberia, INN 2443022960, Krasnoyarsk region. In net assets of the company amounted to more than 1 billion RUB.
The smallest size of net assets in TOP-50 had LLC NPP SVT, INN 6316045070, Samara region. The lack of property of the company in 2019 was expressed in negative terms -96 million RUB.
For the last six years, the average values of TOP-50 net assets showed the growing tendency with positive dynamics of growth rates (Picture 1).
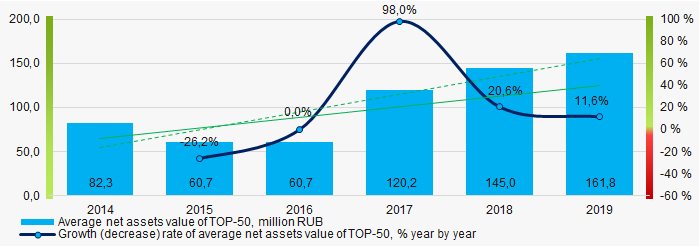 Picture 1. Change in average net assets value of ТОP-50 companies in 2014 – 2019
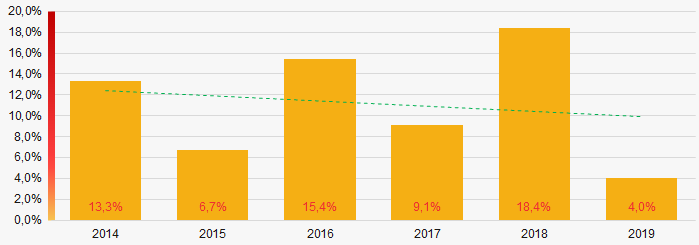
For the last six years, the share of ТОP-50 enterprises with lack of property is decreasing (Picture 2).
 Picture 2. The share of enterprises with negative net assets value in ТОP-50 in 2014-2019
Sales revenue
In 2019, the total revenue of 10 largest companies amounted to 66% from ТОP-50 total revenue (Picture 3). This fact testifies the high level of monopolization in the industry.
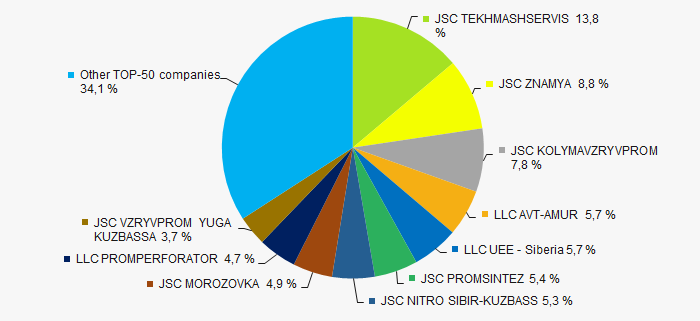 Picture 3. Shares of TOP-10 in TOP-50 total revenue for 2019
In general, the growing trend in sales revenue with negative dynamics of growth rates is observed (Picture 4).
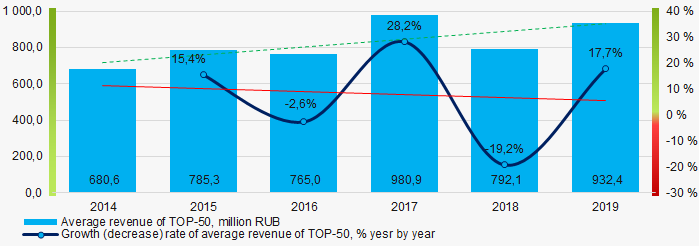 Picture 4. Change in average revenue of TOP-50 in 2014 – 2019
Profit and loss
The largest company in terms of net profit is LLC PROMPERFORATOR, INN 6335009648, Samara region. In 2019 the company’s profit amounted to 364 million RUB.
For the last six years, the average profit values of TOP-50 show the growing tendency (Picture 5).
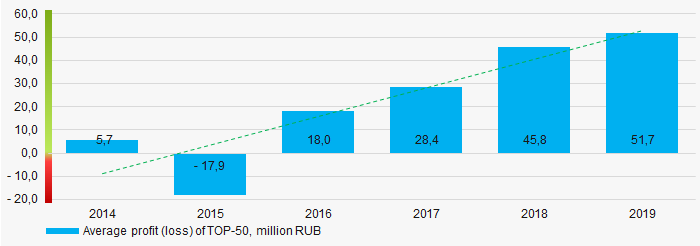 Picture 5. Change in average profit (loss) in 2014 – 2019
Over a six-year period, the average net profit values of ТОP-50 show the growing tendency, along with this the average net loss is decreasing (Picture 6).
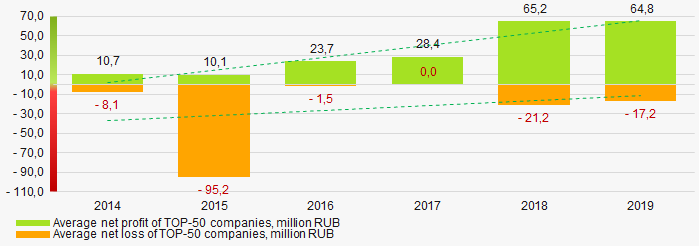 Picture 6. Change in average net profit/loss of ТОP-50 companies in 2014 – 2019
Main financial ratios
For the last six years, the average values of the current liquidity ratio were within the recommended values - from 1,0 to 2,0, with growing trend (Picture 7).
The current liquidity ratio (ratio of total working capital to short-term liabilities) shows the sufficiency of company’s assets to meet short-term obligations.
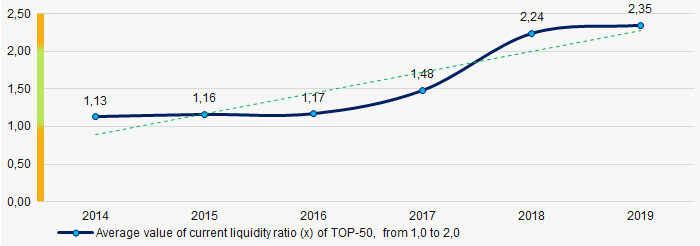 Picture 7. Change in average values of current liquidity ratio in 2014 – 2019
Within six years, the growing trend of the average values of ROI ratio is observed (Picture 8).
The ROI ratio is calculated as a ratio of net profit to sum of stockholder equity and long-term liabilities and shows the return from equity involved in commercial activities and long-term borrowed funds.
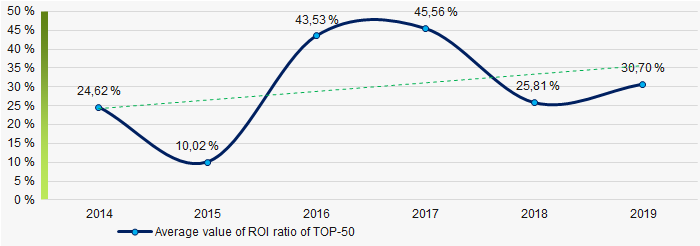 Picture 8. Change in average values of ROI ratio in 2014 – 2019
Assets turnover ratio is the ratio of sales revenue and company’s average total assets for a period. It characterizes the effectiveness of using of all available resources, regardless the source of their attraction. The ratio shows how many times per year the full cycle of production and circulation is performed, generating the corresponding effect in the form of profit.
For the last six years, this business activity ratio demonstrated the downward trend (Picture 9).
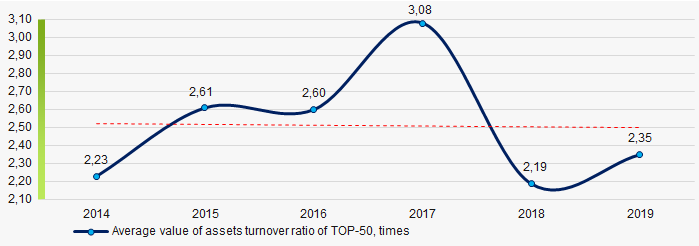 Picture 9. Change in average values of assets turnover ratio in 2014 – 2019
Small businesses
46% of ТОP-1000 companies are registered in the Unified register of small and medium-sized enterprises of the Russian Federal Tax Service. Herein, their share in TOP-50 total revenue is only 9%, which is more than twice lower than the national average value in 2018 – 2019 (Picture 10).
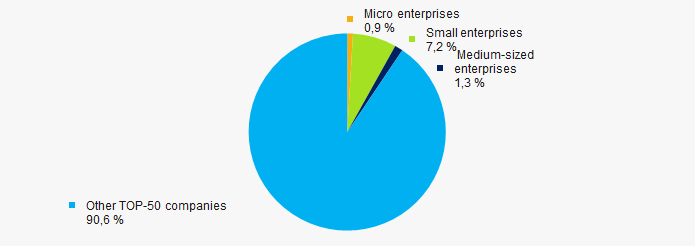 Picture 10. Shares of small and medium-sized enterprises in ТОP-50
Main regions of activity
TOP-50 companies are registered in 23 regions of Russia and are unequally located across the country, mainly in accordance with the geographical location of mineral deposits, for the development of which industrial explosives are used. Almost 56% of the largest enterprises in terms of revenue are located Kuzbass, Samara region, and Moscow (Picture 11).
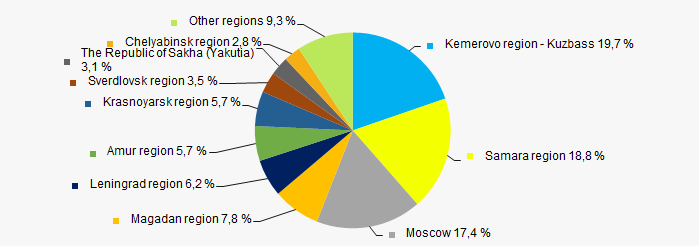 Picture 11. Distribution of TOP-50 revenue by the regions of Russia
Financial position score
An assessment of the financial position of TOP-50 companies shows that the largest part have average financial position (Picture 12).
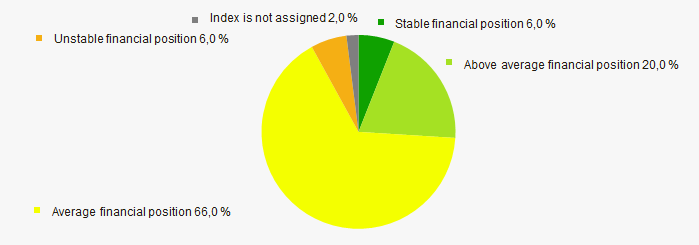 Picture 12. Distribution of TOP-50 companies by financial position score
Solvency index Globas
Most of TOP-50 companies got adequate/weak Solvency index Globas, this fact shows the ability of the companies to meet their obligations in time and fully (Picture 13).
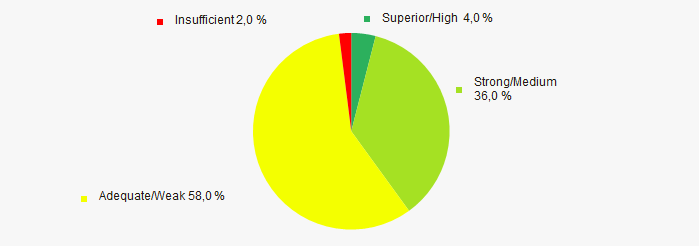 Picture 13. Distribution of TOP-50 companies by Solvency index Globas
Conclusion
A complex assessment of activity of the largest Russian manufacturers of industrial explosives, taking into account the main indexes, financial ratios and indicators, demonstrates the presence of positive trends within 2014-2019 (Table 1).
| Trends and assessment factors | Relative share, % |
| Dynamics of average net assets value | |
| Growth/drawdown rate of average net assets value | |
| Increase / decrease in the share of enterprises with negative net assets | |
| The level of competition / monopolization | |
| Dynamics of average net profit | |
| Growth/drawdown rate of average revenue | |
| Dynamics of average revenue | |
| Increase / decrease in average net profit of companies | |
| Increase / decrease in average net loss of companies | |
| Increase / decrease in average values of current liquidity ratio | |
| Increase / decrease in average values of ROI ratio | |
| Increase / decrease in average values of assets turnover ratio, times | |
| Share of small and medium-sized businesses by revenue more than 22% | |
| Regional concentration | |
| Financial position (the largest share) | |
| Solvency index Globas (the largest share) | |
| Average value of factors | |
![]() favorable trend (factor),
favorable trend (factor), ![]() unfavorable trend (factor).
unfavorable trend (factor).