Information agency Credinform has prepared a ranking of light industry enterprises in Russia. The manufacturers of textile, clothes, leather goods. (TOP-10) with the largest annual revenue were selected for the ranking, according to the data from the Statistical Register and the Federal Tax Service for the latest available accounting periods (2017 - 2019). Then the enterprises were ranked by the accounts receivable turnover (Table 1). The analysis was based on the data from the Information and Analytical system Globas.
Accounts receivable turnover (days) is calculated as a ratio of the accounts receivable average value for a period to sales revenue. The ratio shows how many days it takes for an enterprise to pay off the average sum of its accounts receivable.
The indicator reflects the procedure of satisfaction of liablilities to contractors. It is calculated for cash flow assesment, that gives an opportunity to make conclusions on company’s working efficiency and the chosen financial strategy.
The lower the indicator is, the faster an enterprise settles accounts with suppliers. The increase of turnover indicates both the problems with payment of accounts, and more effective organization of relations with suppliers, providing more profitable and well-managed payment schedule and using accounts receivable as a source of cheap financial resources.
In order to get the most comprehensive and fair picture of the financial standing of an enterprise it is necessary to pay attention to all combination of financial indicators and company’s ratios.
Name, INN, region | Revenue, million RUB | Net profit (loss), million RUB | Accounts receivable turnover, days | Solvency index Globas | |||
2018 | 2019 | 2018 | 2019 | 2018 | 2019 | ||
1 | 2 | 3 | 4 | 5 | 6 | 7 | 8 |
JSC GLORIA JEANS CORPORATION INN 6166034397 Rostov region |
![]() |
![]() |
![]() |
![]() |
![]() |
![]() |
262 Medium |
PV OOO FIRMA TECHHNOAVIA INN 7724152603 Moscow |
![]() |
![]() |
![]() |
![]() |
![]() |
![]() |
184 High |
LLC AVGOL INN 7116128972 Tula region |
![]() |
![]() |
![]() |
![]() |
![]() |
![]() |
250 Medium |
AO FPG ENERGOKONTRAKT INN 7703268269 Moscow |
![]() |
![]() |
![]() |
![]() |
![]() |
![]() |
207 Strong |
NJSC Ralf Ringer INN 7718160370 Moscow |
![]() |
![]() |
![]() |
![]() |
![]() |
![]() |
293 Medium |
LLC MIRTEX INN 3702644450 Ivanovo region |
![]() |
![]() |
![]() |
![]() |
![]() |
![]() |
187 High |
TDL TEXTILE, LLC. INN 3730010504 Ivanovo region |
![]() |
![]() |
![]() |
![]() |
![]() |
![]() |
261 Medium |
Company Limited BELLA INN 5011021499 Moscow region |
![]() |
![]() |
![]() |
![]() |
![]() |
![]() |
165 Superior |
LLC AVANGARD INN 7826741774 Leningrad region |
![]() |
![]() |
![]() |
![]() |
![]() |
![]() |
213 Strong |
OOO PROMKOMPLEKTATSIYA INN 7721624833 Moscow region |
![]() |
![]() |
![]() |
![]() |
![]() |
![]() |
241 Strong |
Average value for TOP-10 | ![]() |
![]() |
![]() |
![]() |
![]() |
![]() |
|
Average value for TOP-1000 | ![]() |
![]() |
![]() |
![]() |
![]() |
![]() |
improvement compared to prior period,
decline compared to prior period
Average value of accounts receivable turnover of TOP-10 is lower than the average TOP-1000 value. Four companies have the standard value in 2019 comparing to the previous period.
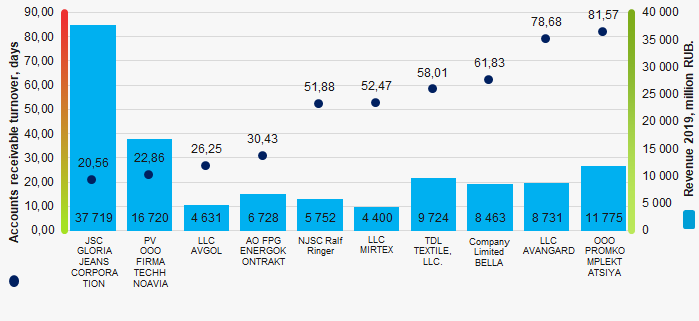
During 6 years the average industry values of accounts receivable turnover had a trend to increase. (Picture 2)
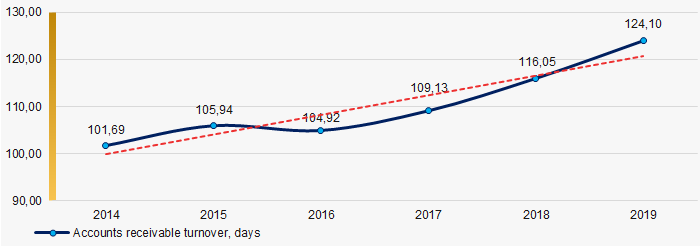
Information agency Credinform has prepared a review of the activity trends of the largest companies of real economy in Chelyabinsk during the financial crisis of 2008 – 2009 years.
The largest enterprises (TOP-1000) in terms of annual revenue were selected for the analysis according to the data from the Statistical Register for the period of 2006 – 2011 years. The analysis was based on the data from the Information and Analytical system Globas.
The number of active companies From 2006 to 2011, the number of active companies increased, but the growth rates decreased especially during the acute phase of the crisis and the period of recovery.

Net assets are total assets less total liabilities. This indicator reflects the real value of the property of an enterprise. When the company’s debt exceeds the value of its property, the indicator is considered negative (insufficiency of property).
The largest company of the real sector of economy in Chelyabinsk in term of net assets was JSC CHELYABINSK PIPE PLANT, INN 7449006730. In 2011, net assets value of the company amounted to 18,9 billion RUB, in 2019 - to 18,8 billion RUB.
The lowest net assets value among TOP-1000 was recorded for CHELYABINSK TRAKTOR PLANT-URALTRAC LIMITED, INN 7452027843. In 2011, insufficiency of property of the company was indicated in negative value of -616 million RUB, and in 2019 the figure amounted to -12,3 billion RUB in 2018.
In 2006 - 2011, the average net assets values of TOP-1000 had a trend to increase, however, the growth rates were decreasing especially during the acute phase of the crisis (Picture 2).

In general, the shares of TOP-1000 companies with insufficient property had a trend to increase in 2006-2011(Picture 3).

Sales revenue
The largest company of the real sector of economy in Chelyabinsk by revenue was CHELYABINSK METALLURGICAL PLANT JSC, INN 7450001007. The revenue volume amounted to 99,2 billion RUB in 2011, and rolled over to 113 billion RUB in 2019.
In general, there was a trend to increase in revenue with increasing growth rate (Picture 4).

Profit and loss
The largest company of the real sector of economy in Chelyabinsk in term of net profit was JOINT STOCK COMPANY TRUBODETAL, INN 7451047011. The company’s profit amounted to 2,8 billion RUB in 2011, and the loss was registered amounting to -822 million RUB in 2019.
During the period of 2006 – 2011, the average profit figures of TOP-1000 companies had a trend to decrease (Picture 5).

In 2006 – 2011, the average net profit figures of TOP-1000 companies had a trend to decrease with the increasing average net loss (Picture 6).

Key financial ratios
In 2006 – 2011, the average values of the current liquidity ratio of TOP-1000 were above the recommended one – from 1,0 to 2,0, with a trend to increase. (Picture 7).
Current liquidity ratio (current assets to short-term liabilities) shows the sufficiency of company’s assets to repay on short-term liabilities.

At the period of 2006 – 2011, there was a general trend to decrease in the average ROI values (Picture 8).
ROI ratio is calculated as net profit to sum of shareholders equity and long-term liabilities, and shows the return of equity involved in commercial activities and long-term borrowed funds.

Assets turnover ratio is the ratio of sales revenue and company’s average total assets for a period. It characterizes the effectiveness of using of all available resources, regardless the source of their attraction. The ratio shows how many times per year the full cycle of production and circulation is performed, generating the corresponding effect in the form of profit.
In 2006 – 2011, there was a trend to decrease of this ratio, especially during the acute phase of the crisis and the period of recovery. (Picture 9).

Small enterprises
80% companies of TOP-1000 are registered in the Register of small and medium-sized enterprises of the Federal Tax Service of the Russian Federation. However, their share in total revenue of TOP-1000 amounted 15% in 2011 (Picture 10).

Financial position score
According to the assessment, the financial position of most of TOP-1000 companies is average in 2020 (Picture 11).

Solvency index Globas
In 2020, most of TOP-1000 companies got Superior / High and Strong / Medium index Globas. This fact shows their ability to meet their obligations fully and by the due date (Picture 12).

Conclusion
Complex assessment of activity of the largest companies of the real economy sector of Chelyabinsk, taking into account the main indexes, financial ratios and indicators, demonstrates the prevalence of negative trends in 2006 - 2011 (Table 1).
Trends and evaluation factors | Relative share of factor, % | Possible forecast |
Dynamics of the number of active companies | ![]() |
|
Rate of growth of the number of active companies | ![]() |
During the acute phase of the crisis and the period of recovery, rate of growth of the number of active companies may be decreased |
Dynamics of the average net assets value | ![]() |
|
Rate of growth (decline) in the average size of net assets | ![]() |
During the acute phase of the crisis and the period of recovery, rate of growth in the net assets may be decreased |
Increase / decrease in the share of enterprises with negative values of net assets | ![]() |
During the beginning of the crisis, the share of companies with negative values of net assets may be increased |
Dynamics of the average revenue | ![]() |
|
Rate of growth (decline) in the average size of revenue | ![]() |
During the acute phase of the crisis, rate of growth in revenue may be decreased |
Dynamics of the average profit | ![]() |
During the acute phase of the crisis and the period of recovery, rate of growth in average profit may be decreased |
Growth / decline in average values of companies’ net loss | ![]() |
During the acute phase of the crisis and the period of recovery, net profit may be increased |
Growth / decline in average values of companies’ net loss | ![]() |
During the acute phase of the crisis and the period of recovery, net loss may be increased |
Increase / decrease in average values of current liquidity ratio | ![]() |
|
Increase / decrease in average values of return on investment ratio | ![]() |
During the acute phase of the crisis and the period of recovery, return on investment ratio may by decreased |
Increase / decrease in average values of asset turnover ratio, times | ![]() |
During the acute phase of the crisis and the period of recovery, business activity may by decreased |
Share of small and medium-sized businesses in terms of revenue being more than 20% | ![]() |
|
Financial position (the largest share) | ![]() |
|
Solvency index Globas (the largest share) | ![]() |
|
Average value of relative share of factors | ![]() |
positive trend (factor),
negative trend (factor).