
Order a report
Custom-made industry research, company ratings, competitor analysis


Trends in the field of supporting activities in air transport
Information agency Credinformrepresents an overview of trends in the field of supporting activities in air transport.
The enterprises with the largest volume of annual revenue were selected for the analysis, according to the data from the Statistical Register for the latest available periods (for 2015 and 2016), which are engaged in supporting activities in air transport, including airports (TOP-10 and TOP-300). The analysis was made on the basis of the data of the Information and analytical system Globas.
Legal forms
The most spread legal form of enterprises in the field of supporting activities in air transport is a limited liability company. Public and non-public joint-stock companies also make a significant part. (Picture 1).
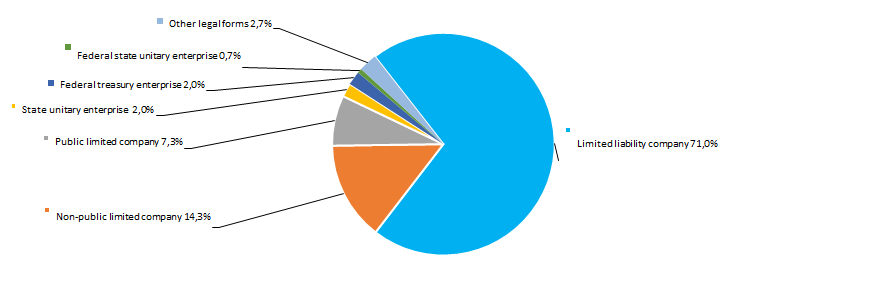 Picture 1. Distribution of TOP-300 companies by legal forms
Revenue from sales
The revenue of 10 industry leaders made 70% of the total revenue of 300 the largest companies in 2016. It points to a high level of monopolization in the industry. The largest company in terms of revenue in 2016 was FGUP STATE FEDERAL UNITARY ENTERPRISE STATE ATM CORPORATION (Picture 2).
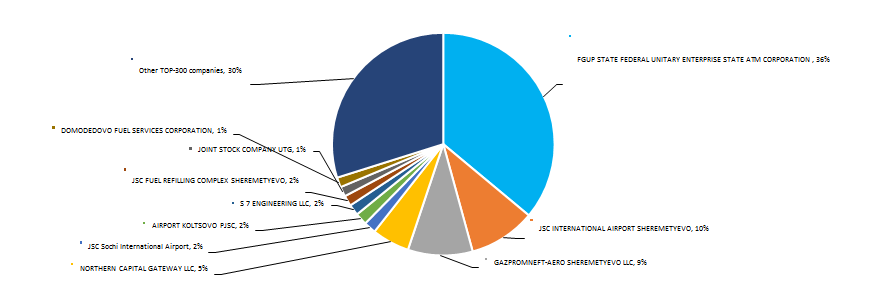 Picture 2. The share of participation of TOP-10 enterprises in the total revenue of TOP-300 companies for 2016, %
The best results in the industry in terms of revenue for the ten-year period were achieved in 2011. During the crisis periods in the economy in 2009 and from 2012 up to 2015, there was a decline observed in the industry average indicators. (Picture 3).
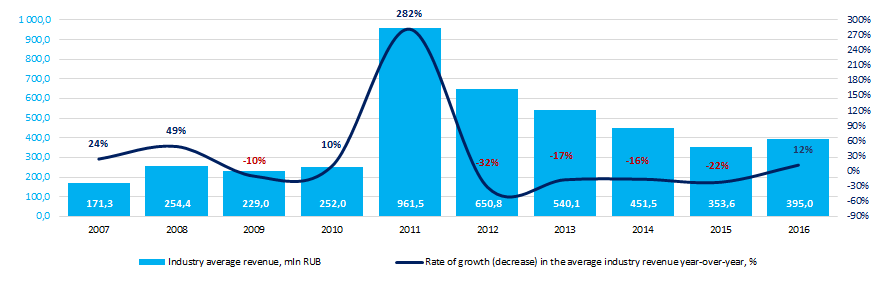 Picture 3. Change in the industry average indicators of revenue of companies in the field of supporting activities in air transport in 2007-2016х
Profit and losses
The profit of 10 industry leaders made 84% of the total profit of TOP-300 companies in 2016. The leading position in terms of profit volume in 2016 is taken also by FGUP STATE FEDERAL UNITARY ENTERPRISE STATE ATM CORPORATION (Picture 4).
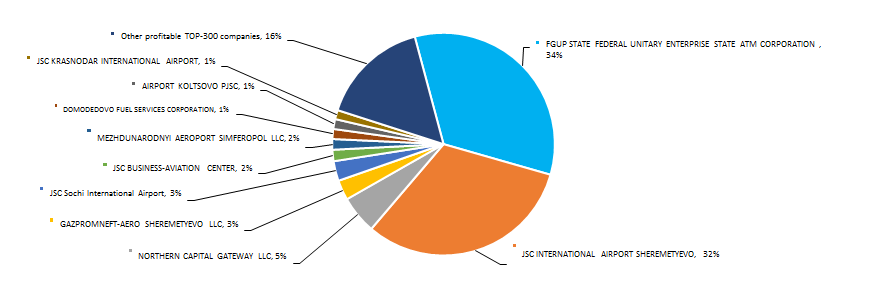 Picture 4. Shares of participation of TOP-10 enterprises in the total volume of profit of TOP-300 companies for 2016, %
 Industry values of the profit indicators of air transport companies for the ten-year period are not stable. Decrease in indicators was observed in 2010, 2012 and in 2014 against the background of crisis phenomena in the economy. At the same time, the industry average indicators of profit were negative in 2014 - 2015. The industry showed the best results in 2016 (Picture 5).
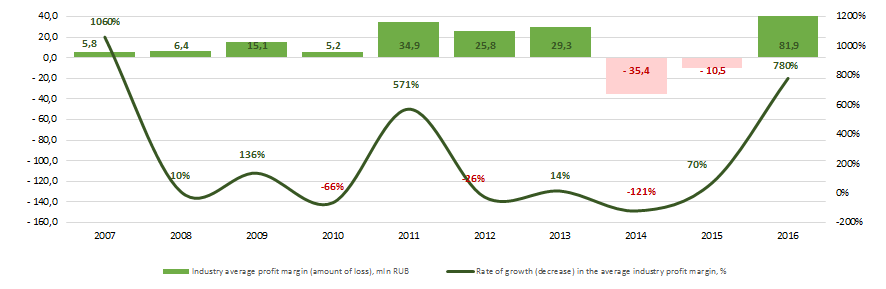 Picture 5. Change in the industry average indicators of profit of companies in the field of supporting activities in air transport in 2007 - 2016
There were 97 loss-making enterprises observed in 2015 among TOP-300 companies. In 2016 their number reduced to 91 or by 6%. At the same time, the average size of their loss decreased by 68%. For the rest of TOP-300 companies the average profit margin increased by 32% during the same period (Picture 6).
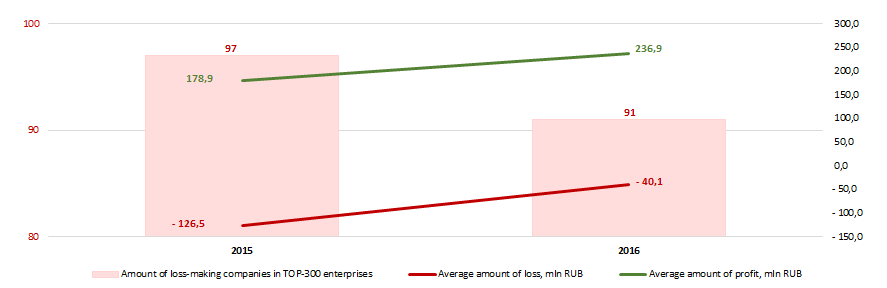 Picture 6. Amount of loss-making companies, average value of loss and profit of TOP-300 enterprises in 2015-2016
 Capital and reserves
At year-end 2016 the largest amount of capital and reserves among TOP-300 companies was by FGUP STATE FEDERAL UNITARY ENTERPRISE STATE ATM CORPORATION. The worst position for this indicator was by TSENTR UPRAVLENIYA NAZEMNYM OBSLUZHIVANIEM LLC(Table 1).
| Sequence number in TOP-300 | Name | Capital and reserves, Bln RUB * | |
| 2015 | 2016 | ||
| 1. | FGUP STATE FEDERAL UNITARY ENTERPRISE STATE ATM CORPORATION | 98,23 | 115,75 |
| 2. | JSC INTERNATIONAL AIRPORT VNUKOVO | 1,93 | 18,81 |
| 3. | LLC SABETTA INTERNATIONAL AIRPORT | 15,25 | 16,96 |
| 4. | AIRPORT KOLTSOVO PJSC | 9,13 | 14,85 |
| 5. | NORTHERN CAPITAL GATEWAY LLC | 10,73 | 10,73 |
| 6. | MEZHDUNARODNYI AEROPORT KAZAN NAO | 5,57 | 5,89 |
| 7. | SUE DOMODEDOVO AIRPORT ADMINISTRATION | 5,61 | 5,73 |
| 8. | LLC AIRPORT NORILSK | 5,72 | 5,39 |
| 9. | JSC KRASNODAR INTERNATIONAL AIRPORT | 4,21 | 4,86 |
| 10. | JSC UZHNO-SAKHALINSK AIRPORT | 3,45 | 3,89 |
| 291. | TZK KIROV LLC | -20,10 | -23,36 |
| 292. | SIBIR CARGO SERVICE LIMITED | -41,08 | -24,45 |
| 293. | BASEL AERO LLC | -34,53 | -34,10 |
| 294. | AEROPORT PJSC | -80,19 | -34,77 |
| 295. | BALTIK GRAUND SERVISES RU LLC | -11,00 | -50,76 |
| 296. | BALTIK GRAUND SERVISES RU LLC | -50,12 | -56,99 |
| 297. | TSENTR AVIA LLC | -123,21 | -136,68 |
| 298. | AVIASERVIS LLC | -141,00 | -177,75 |
| 299. | JSC BELGORODAVIA | -877,92 | -924,42 |
| 300. | TSENTR UPRAVLENIYA NAZEMNYM OBSLUZHIVANIEM LLC | 8,83 | -989,11 |
*) The companies with positive dynamics of the indicator in 2016 compared to the previous year are marked with green filling in Table 1, with negative dynamics - with red filling.
There were 45 enterprises with a negative value of capital and reserves observed among TOP-300 companies in 2015. In 2016 their number increased up to 50 or by 11%. At the same time, the average size of capital and reserves increased by 36% for the same period (Picture 7).
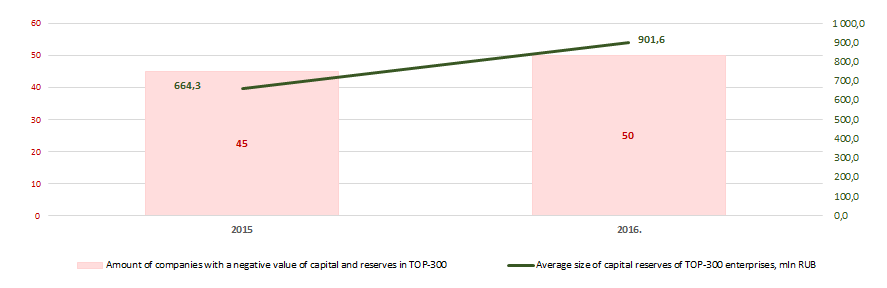 Picture 7. Amount of companies with a negative value of capital and reserves and average size of capital reserves of TOP-300 enterprises in 2015 – 2016
Key financial ratios
Over the ten-year period the average industry indicators of the total liquidity ratio were below the range of recommended values from 1,0 to 2,0 during 5 years.(marked in yellow in Picture 8).
The total liquidity ratio (the relation of the amount of current assets to short-term liabilities) shows the sufficiency of company’s funds for repayment of its short-term liabilities.
The solvency ratio (the relation of the amount of own capital to the balance sum) shows the company's dependence on external borrowings. Recommended value is > 0.5. The value of the coefficient below the minimum value means a strong dependence on external sources of funds’ receipt.
The experts of the Information Agency Credinform, taking into account the actual situation both in the economy as a whole and in sectors, has developed and implemented in the Information and analytical system Globas the calculation of practical values of financial ratios that can be recognized as normal for a particular industry. For companies in the field of supporting activities in air transport the practical value of the solvency ratio ranges from 0,02 up to 0,82.
Over the ten-year period the industry average indicators of the coefficient were below the recommended value and in the interval of practical values (Picture 8).
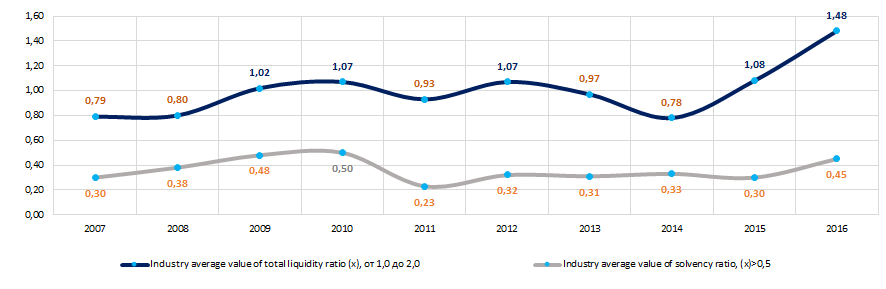 Picture 8. Change in the industry average values of the total liquidity and solvency ratios of companies in the field of supporting activities in air transport in 2007–2016
There has been an instability observed in indicators of the return on investment ratio during ten years. In periods of crisis phenomena in the economy (in 2014, 2015) the indicators decreased to negative values (Picture 9). The ratio is calculated as the relation of net profit to the sum of own capital and long-term liabilities and demonstrates the return on the equity involved in the commercial activity and the long-term borrowed funds of an organization.
The indicators of the profitability ratio of products (services) were relatively stable in the same period (Picture 9). The growth of indicators is observed in 2014 - 2016. The ratio is calculated as the relation of profit from sales to expenses for ordinary activity. In general, profitability reflects the economic efficiency of production.
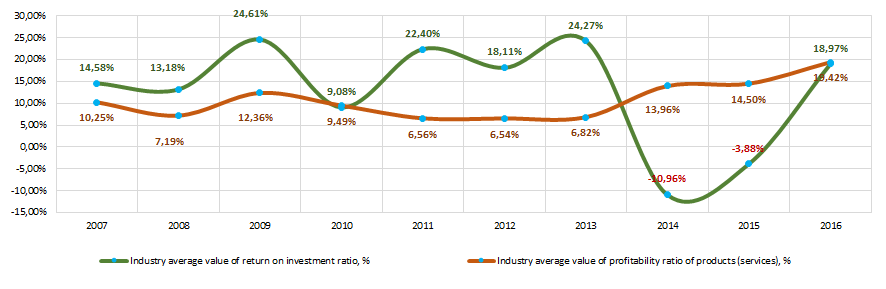 Picture 9. Change in the industry average values of the return on investment and profitability ratio of services of companies in the field of supporting activities in air transport in 2007 – 2016
 Indicators of the asset turnover ratio over a ten-year period demonstrate instability with a sharp increase in 2011 - 2013 and a decline in 2014 - 216 (Picture 10).
Asset turnover ratio is calculated as the relation of sales proceeds to the average value of total assets for a period and characterizes the efficiency of use of all available resources, regardless of the sources of their attraction. The coefficient shows how many times a year a complete cycle of production and circulation is made, yielding profit.
Equity turnover ratio is calculated as the relation of revenue to average annual amount of equity and shows the intensity of use of the whole part of assets.
There is a significant decrease in the indicators of this coefficient observed in 2014-2016 (Picture 10).
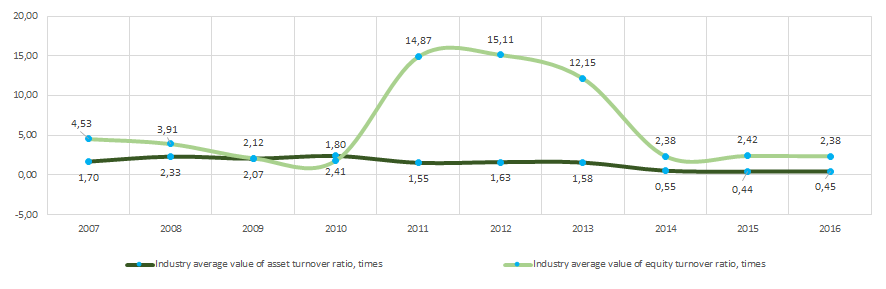 Picture 10. Change in the industry average values of the activity ratios of companies in the field of supporting activities in air transport in 2007 – 2016
Structure of services
Almost half of companies in the TOP-300 list specialize in airport services (Picture 11).
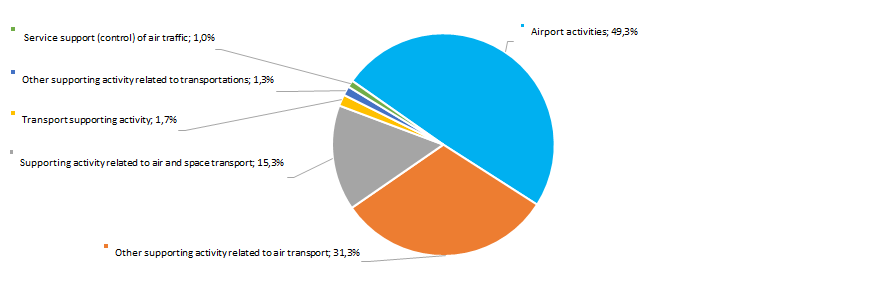 Picture 11. Distribution of TOP-300 companies by types of services provided, %
Dynamics of business’ activity
Over the 25-year period the number of registered companies from the TOP-300 list is distributed by years of their foundation non uniform. The largest number of enterprises in the field of supporting activities in air transport was established in 2009 (Picture 12).
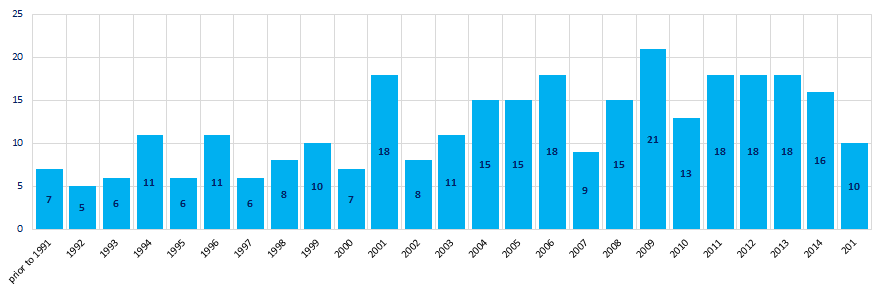 Picture 12. Distribution of TOP-300 companies by years of their foundation
Business took the greatest interest to supporting activities in air transport during the period 2010-2014, when on average 17 new companies were registered per annum. (Picture 13).
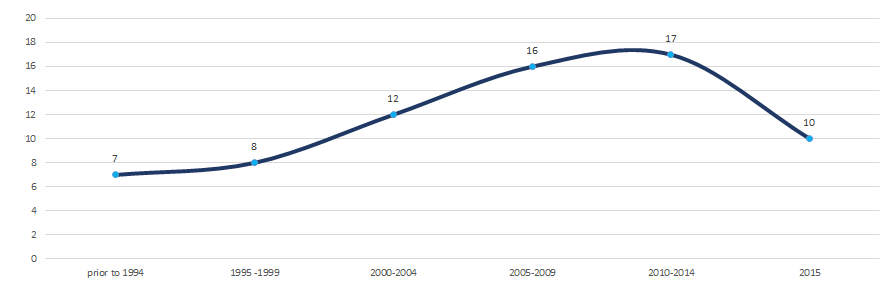 Picture 13. Average number of TOP-300 companies registered within the year, by periods of their foundation
Main regions of activity
Companies in the field of supporting activities in air transport are distributed throughout the country non uniform. Their largest number is registered in Moscow region and Moscow city - the biggest regions of the country in terms of population size with a developed transport infrastructure (Picture 14). TOP-300 companies are registered in 61 regions of Russia.
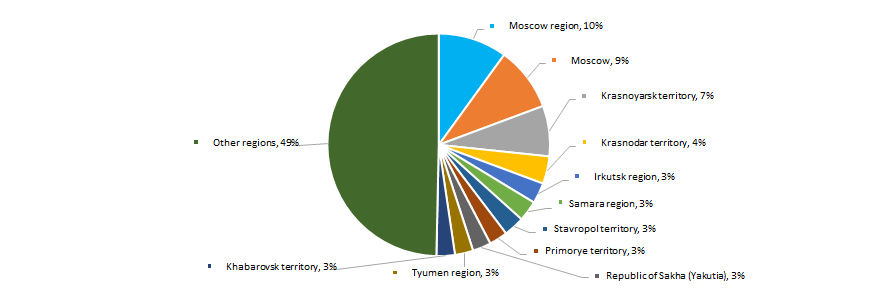 Picture 14. Distribution of TOP-300 companies by regions of Russia
The largest number of companies in the field of supporting activities in air transport is concentrated in the Central Federal District of the country (Picture 15).
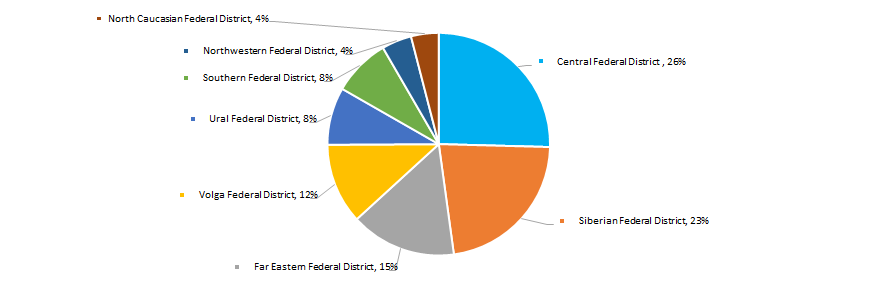 Picture 15. Distribution of TOP-300 companies by federal regions of Russia
The share of companies with branches or representative offices, from TOP-300 enterprises, is 12%.
Activity of participation in arbitration proceedings
The fourth part of companies of the industry does not participate in arbitration proceedings. A significant share is taken by enterprises, which are relatively actively involved in arbitration processes, that may be due to the specifics of the provision of transportation services (Picture 16).
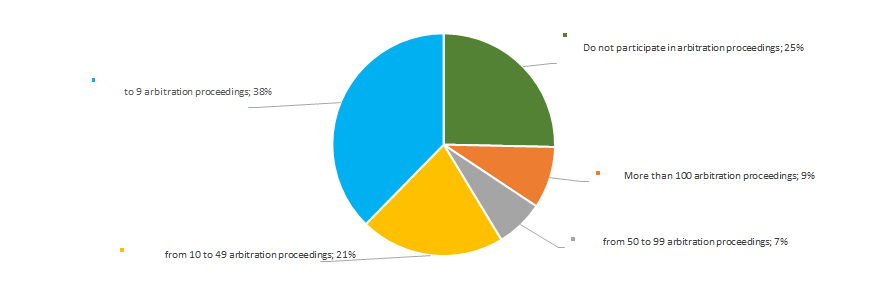 Picture 16. Distribution of TOP-300 companies by the activity of participation in arbitration proceedings, %
Reliability index
In terms of the presence of signs of «fly-by-night companies» or unreliable organizations, the great majority of enterprises of the industry demonstrate an extremely low risk of cooperation (Picture 17).
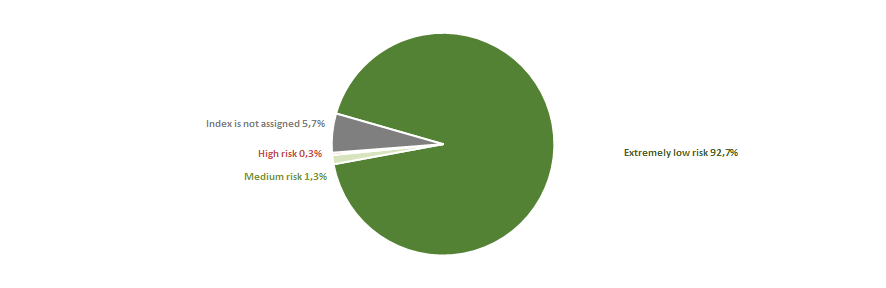 Picture 17. Distribution of TOP-300 companies by reliability index, %
Scoring index
An assessment of the financial position of companies in the industry shows that the largest number of enterprises is in a stable financial position or at a level above the average (Picture 18).
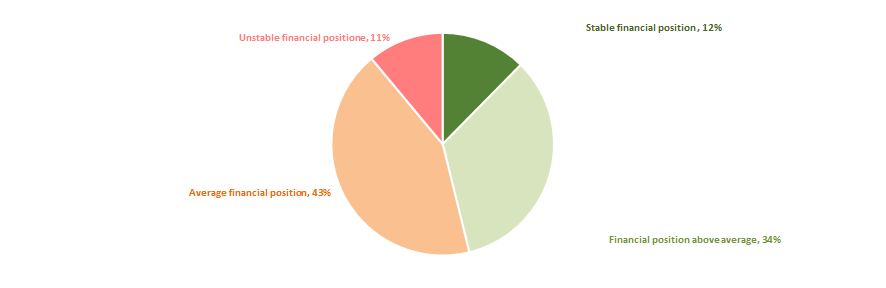 Picture 18. Distribution of TOP-300 companies by scoring index, %
Liquidity index
Most of companies of the industry (55%) show a minimal or insignificant level of bankruptcy risk in the short-term period. However, the share of enterprises with the highest level of risk is at substantial figure of 30% (Picture 19).
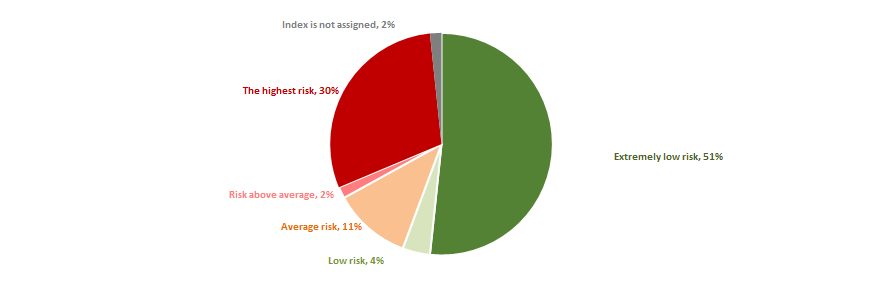 Picture 19. Distribution of TOP-300 companies by liquidity index, %
Solvency index Globas
76% of companies in the field of supporting activities in air transport from among 300 the largest enterprises got the highest or high Solvency index Globas (Picture 20).
As a whole, taking into account the main indices, financial indicators and ratios, this may point to relatively favorable trends in this field of activity.
 Picture 20. Distribution of TOP-300 companies by Solvency index Globas