
Order a report
Custom-made industry research, company ratings, competitor analysis


Activity trends in fish processing
Information agency Credinform represents an overview of activity trends of the largest Russian companies in processing and canning of fish and seafood.
Processing companies with the largest volume of annual revenue (TOP-10 and TOP-1000) were selected for the analysis, according to the data from the Statistical Register for the latest available periods (for 2015-2017). The analysis was made on the basis of the data of the Information and Analytical system Globas.
Net assets value is an indicator, reflecting the real value of company’s property, is calculated annually as the difference between assets on the enterprise balance and its debt obligations. The indicator of net assets is considered negative (insufficiency of property), if company’s debt exceeds the value of its property.
The average values of net assets of TOP-1000 enterprises tend to increase over the ten-year period (Picture 1).
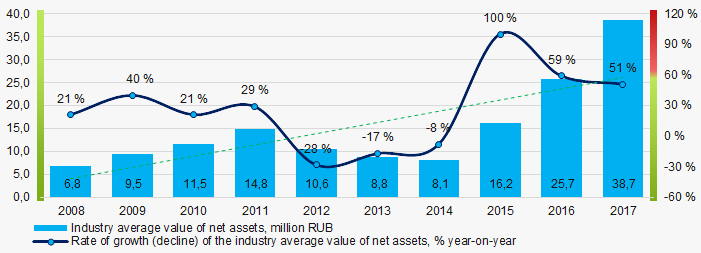 Picture 1. Change in the industry average indicators of the net asset value of companies, processing and canning fish and seafood, in 2008 – 2017
 The shares of TOP-1000 enterprises with insufficiency of assets were at relatively high level with a tendency to increase in the last three years (Picture 2).
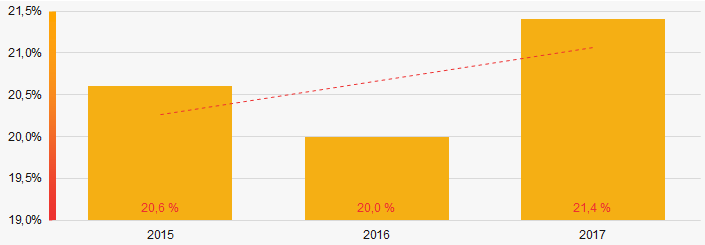 Picture 2. Shares of enterprises with negative values of net assets in TOP-1000 in 2015 – 2017
Sales revenue
The revenue volume of 10 leading companies of the industry made 41% of the total revenue of TOP-1000 in 2017 (Picture 3). It points to a relatively high level of monopolization in the industry.
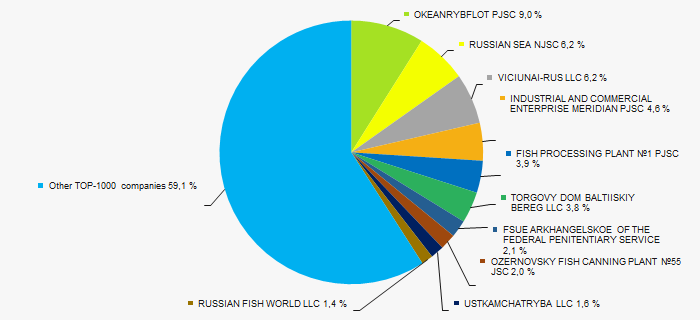 Picture 3. Shares of participation of TOP-10 companies in the total revenue of TOP-1000 enterprises for 2017
In general, there is a trend towards an increase in average industry revenue over the ten-year period (Picture 4).
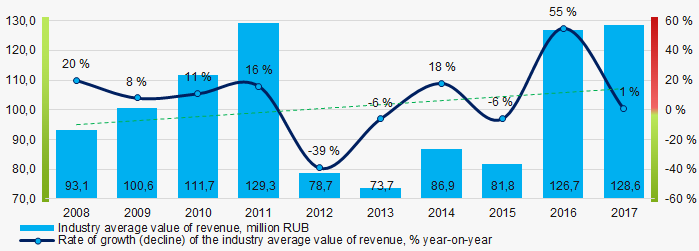 Picture 4. Change in the industry average revenue of TOP-100 companies, processing and canning fish and seafood, in 2008 – 2017
 Profit and loss
Industry average values of net profit trend to increase over the past ten years (Picture 5).
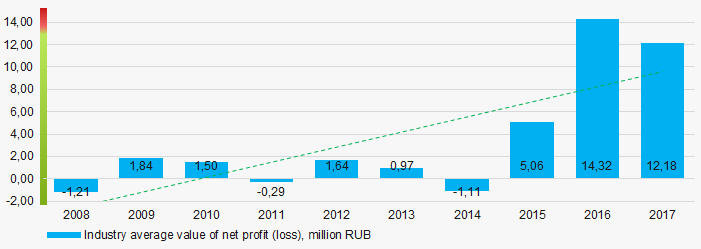 Picture 5. Change in the industry average indicators of net profit of companies, processing and canning fish and seafood, in 2008 – 2017
 Average values of net profit’s indicators of TOP-1000 companies decrease for the three-year period, at the same time the average value of net loss also decreases. (Picture 6).
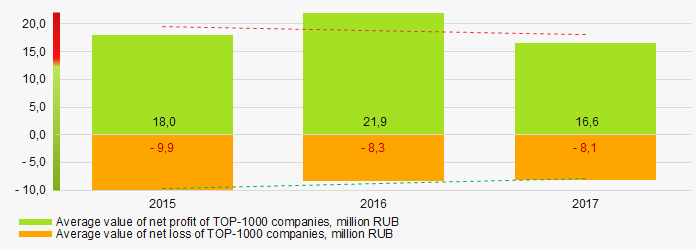 Picture 6. Change in the industry average values of indicators of net profit and net loss of TOP-1000 companies in 2015 – 2017
Key financial ratios
Over the ten-year period the average indicators of the total liquidity ratio of TOP-1000 enterprises were in the range of recommended values - from 1,0 up to 2,0, with a tendency to increase (Picture 7).
The total liquidity ratio (the relation of the amount of current assets to short-term liabilities) shows the sufficiency of company’s funds for repayment of its short-term liabilities.
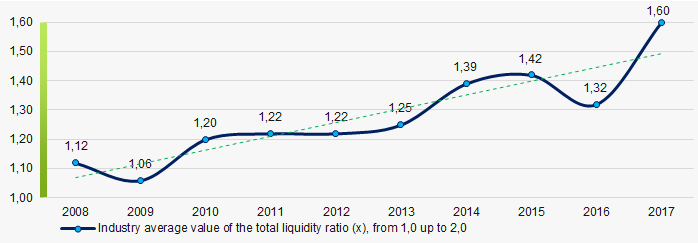 Picture 7. Change in the industry average values of the total liquidity ratio of companies, processing and canning fish and seafood, in 2008 – 2017
The industry average values of the return on investment ratio trend to increase for ten years (Picture 8).
The ratio is calculated as the relation of net profit to the sum of own capital and long-term liabilities and demonstrates the return on the equity of own capital involved in the commercial activity and the long-term borrowed funds of an organization.
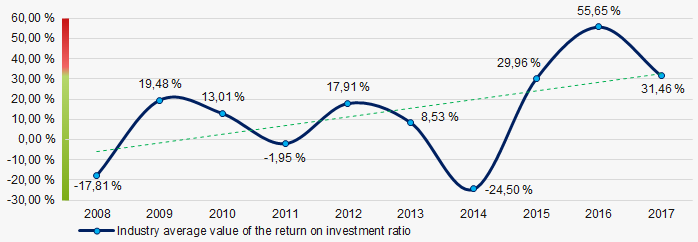 Picture 8. Change in the industry average values of the return on investment ratio of companies, processing and canning fish and seafood, in 2008 – 2017
Asset turnover ratio is calculated as the relation of sales proceeds to the average value of total assets for a period and characterizes the efficiency of use of all available resources, regardless of the sources of their attraction. The ratio shows how many times a year a complete cycle of production and circulation is made, yielding profit.
This ratio of business activity showed a tendency to decrease over the ten-year period (Picture 9).
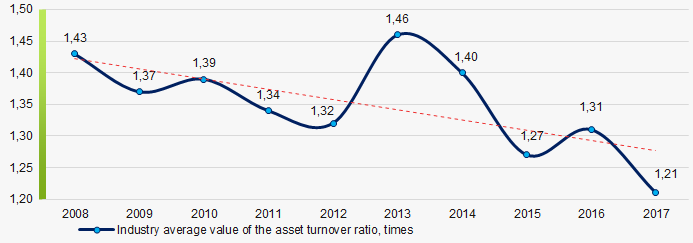 Picture 9. Change in the industry average values of the asset turnover ratio of companies, processing and canning fish and seafood, 2008 – 2017
Small business
93% of TOP-1000 companies are registered in the Register of small and medium-sized enterprises of the Federal Tax Service of the RF. At the same time, their share in the total revenue amounted to 47% that is more than two times higher than the national average (Picture 10).
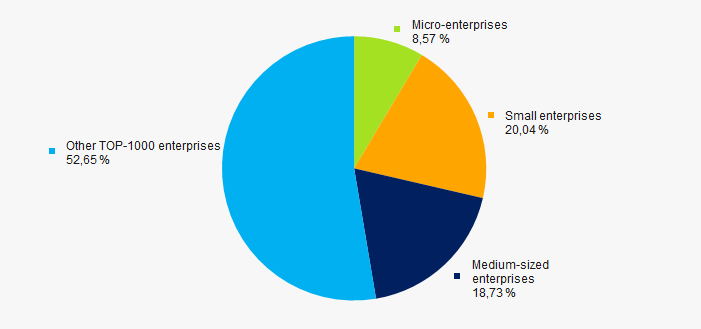 Picture 10. Shares of proceeds of small and medium-sized enterprises in TOP-1000 companies, %
Main regions of activity
The TOP-1000 companies are distributed unequal across Russia, taking into account the specifics of production, and registered in 75 regions. More than 57% of their revenue are concentrated in the Kamchatka territory, Saint-Petersburg, Moscow and Kaliningrad regions (Picture 11).
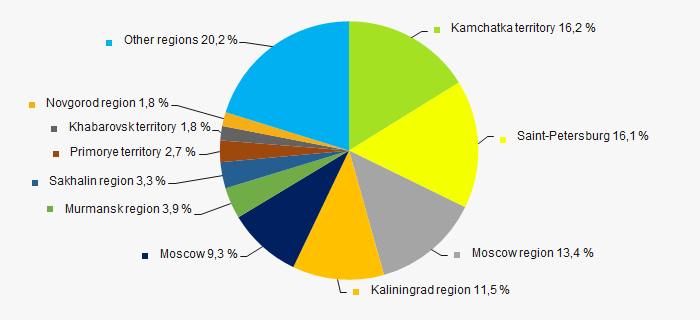 Picture 11. Distribution of the revenue of TOP-1000 companies by Russian regions
Financial position score
An assessment of the financial position of TOP-1000 companies shows that that more than 40% of them are in an average financial position (Picture 12).
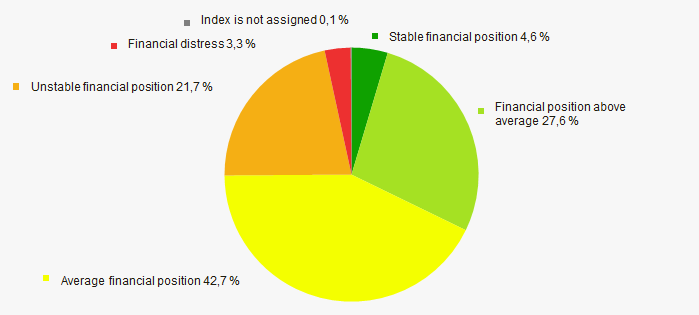 Picture 12. Distribution of TOP-1000 companies by financial position score
Solvency index Globas
The largest part of TOP-1000 companies got Superior/High or Strong/Medium Solvency index Globas, that points to their ability to pay off their debts in time and fully (Picture 13).
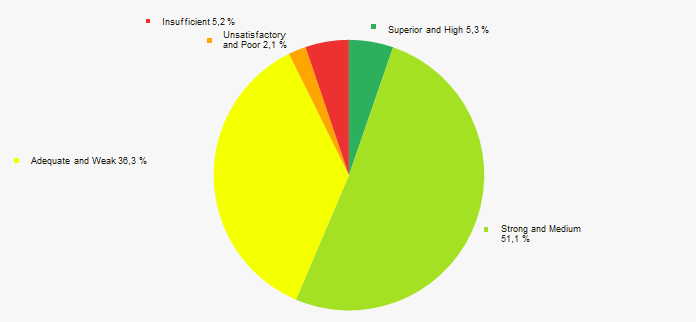 Picture 13. Distribution of TOP-1000 companies by solvency index Globas
Industrial production index
According to the Federal State Statistics Service, there is a tendency towards a decrease in indicators of the industrial production index in the field of processing and canning fish and seafood during 2018 - 2019 (Picture 14). At the same time, the average index from month to month was 102,4%.
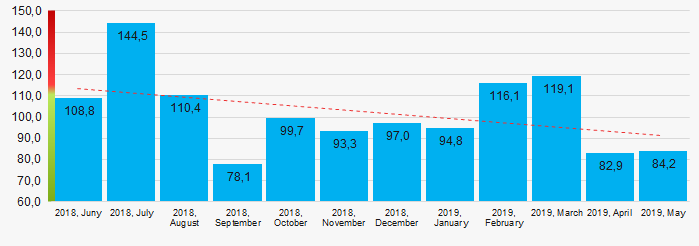 Picture 14. Industrial production index in 2018 – 2019, (%)
According to the same information, the share of processing and canning of fish and seafood in the revenue volume from the sale of goods, products, works, and services made 0,1% countrywide for 2018.
Conclusion
A comprehensive assessment of activity of the largest Russian companies in processing and canning of fish and seafood, taking into account the main indices, financial indicators and ratios, points to the prevalence of positive trends in the industry (Table 1).
| Trends and evaluation factors | Specific share of factor, % |
| Rate of growth (decline) in the average size of net assets | |
| Increase / decrease in the share of enterprises with negative values of net assets | |
| Rate of growth (decline) in the average size of revenue | |
| Level of competition | |
| Rate of growth (decline) in the average size of profit (loss) | |
| Growth / decline in average values of net profit of TOP-1000 companies | |
| Growth / decline in average values of net loss of TOP-1000 companies | |
| Increase / decrease in average values of total liquidity ratio | |
| Increase / decrease in average values of return on investment ratio | |
| Increase / decrease in average values of asset turnover ratio, times | |
| Share of small and medium-sized enterprises in the industry in terms of revenue being more than 22% | |
| Regional concentration | |
| Financial position (the largest share) | |
| Solvency index Globas (the largest share) | |
| Industrial production index | |
| Average value of factors | |
![]() positive trend (factor),
positive trend (factor), ![]() negative trend (factor).
negative trend (factor).