Trends in gambling
Information agency Credinform has prepared a review of activity trends of the largest Russian gambling organizations.
The largest companies (ТОP-100) engaged in conducting of lotteries, gambling establishments, bookmakers and betting houses in terms of annual revenue were selected according to the data from the Statistical Register for the latest available periods (2013 - 2018). The analysis was based on data of the Information and Analytical system Globas.
Net assets is a ratio reflecting the real value of company's property. It is calculated annually as the difference between assets on the enterprise balance and its debt obligations. The ratio is considered negative (insufficiency of property), if company’s debt exceeds the value of its property.
The largest company in terms of net assets is LLC MELOFON, INN 2540179758, Moscow. In 2018 net assets of the company amounted to 5,9 billion RUB.
The smallest size of net assets in ТОP-100 had JSC LOTTERIES OF MOSCOW, INN 7715215381, Moscow. The lack of property of the company in 2018 was expressed in negative terms -213 million RUB.
For the last ten years, the average values of net assets showed the growing tendency (Picture 1).
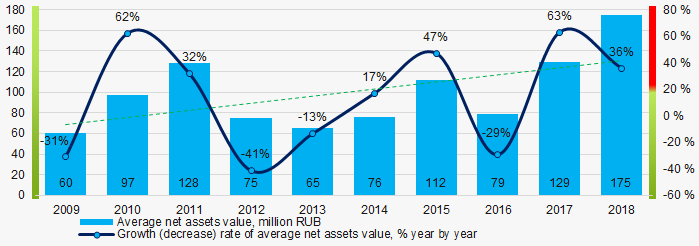 Picture 1. Change in average net assets value in 2009 – 2018
 For the last five years, the share of ТОP-100 enterprises with lack of property showed the decreasing tendency (Picture 2).
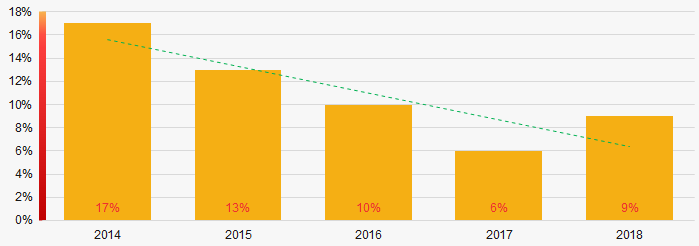 Picture 2. The share of enterprises with negative net assets value in ТОP-100
Sales revenue
In 2018, the total revenue of 10 largest companies amounted to more than 94% from ТОP-100 total revenue. (Picture 3).This fact testifies the high level of monopolization within the industry.
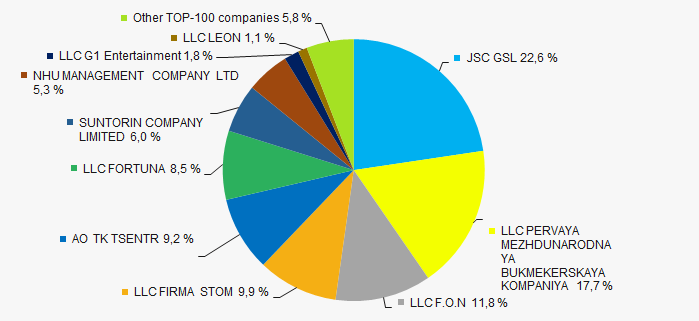 Picture 3. Shares of TOP-10 in TOP-100 total revenue for 2018
In general, the growing trend in sales revenue is observed (Picture 4).
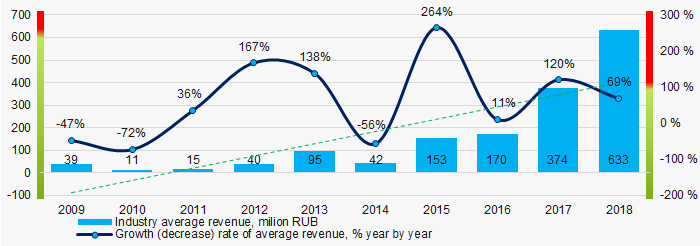 Picture 4. Change in average revenue in 2009 – 2018
Profit and loss
The largest company in terms of net profit is LLC F.O.N, INN 9715010229, Moscow. In 2018, the company’s profit amounted to 9,3 billion RUB.
For the last ten years, the average profit values showed the increasing tendency (Picture 5).
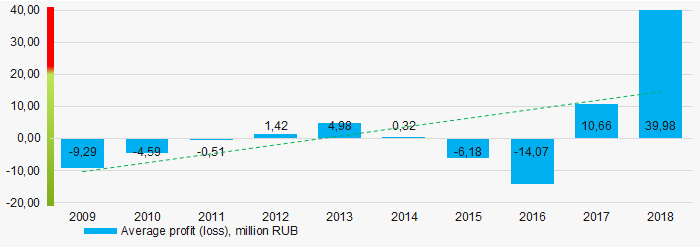 Picture 5. Change in average profit (loss) in 2009 – 2018
Over a five-year period, the average net profit values of ТОP-100 show the increasing tendency, along with this the average net loss is increasing too (Picture 6).
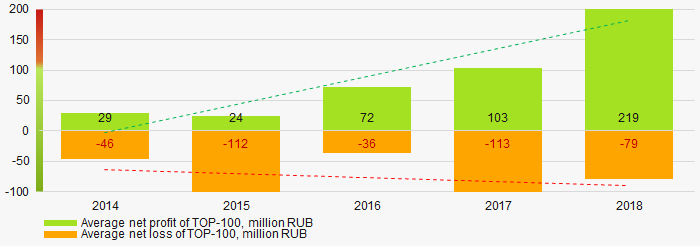 Picture 6. Change in average net profit/loss in 2014 – 2018
Main financial ratios
Since 2013 the average values of the current liquidity ratio are within the recommended values - from 1,0 to 2,0, with decreasing tendency (Picture 7).
The current liquidity ratio (ratio of total working capital to short-term liabilities) shows the sufficiency of company’s assets to meet short-term obligations.
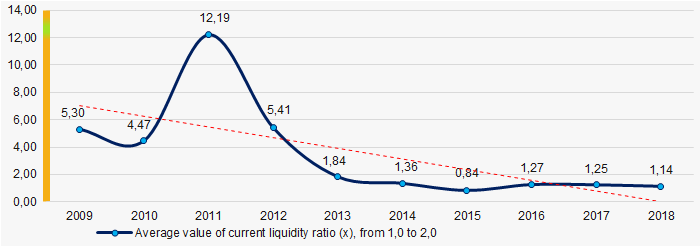 Picture 7. Change in average values of current liquidity ratio in 2009 – 2018
For the last ten years, the growing tendency of ROI ratio is observed (Picture 8).
The ROI ratio is calculated as a ratio of net profit to sum of stockholder equity and long-term liabilities and shows the return from equity involved in commercial activities and long-term borrowed funds.
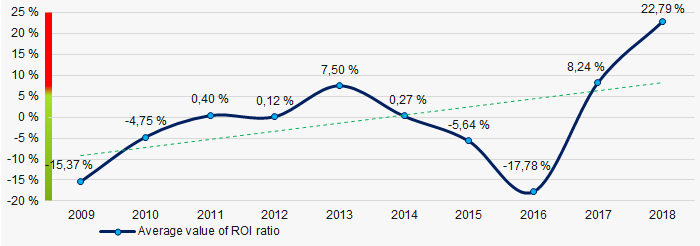 Picture 8. Change in average values of ROI ratio in 2009 – 2018
Assets turnover ratio is the ratio of sales revenue and company’s average total assets for a period. It characterizes the effectiveness of using of all available resources, regardless the source of their attraction. The ratio shows how many times per year the full cycle of production and circulation is performed, generating the corresponding effect in the form of profit.
For the last ten years, this business activity ratio demonstrated the growing trend (Picture 9).
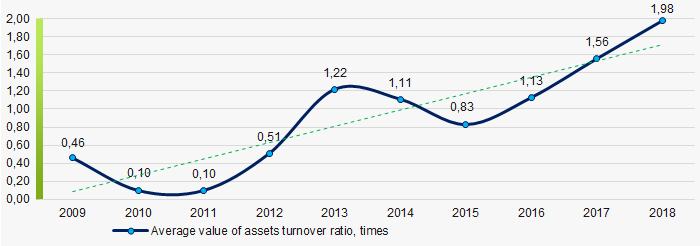 Picture 9. Change in average values of assets turnover ratio in 2009 – 2018
 Small businesses
79% of ТОP-100 companies are registered in the Unified register of small and medium-sized enterprises of the Russian Federal Tax Service. Herein, their share in TOP-100 total revenue amounted to 3,2%, which is significantly lower than national average value (Picture 10).
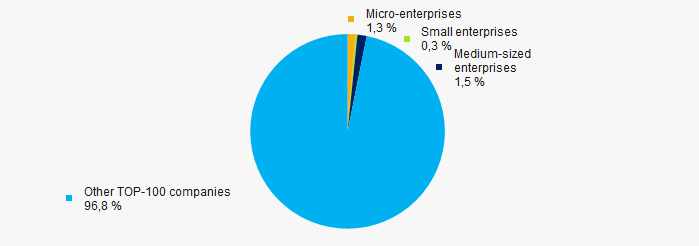 Picture 10. Shares of small and medium-sized enterprises in ТОP-100
Main regions of activity
ТОP-100 companies are registered in 43 regions and unequally located across the country. More than 82% of the largest enterprises in terms of revenue are located in Moscow (Picture 11).
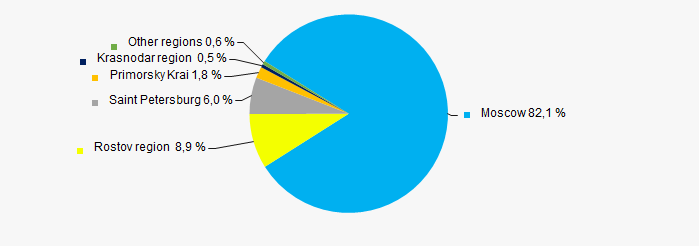 Picture 11. Distribution of TOP-100 revenue by regions of Russia
Financial position score
An assessment of the financial position of TOP-100 companies shows that the largest part have the above average financial position (Picture 12).
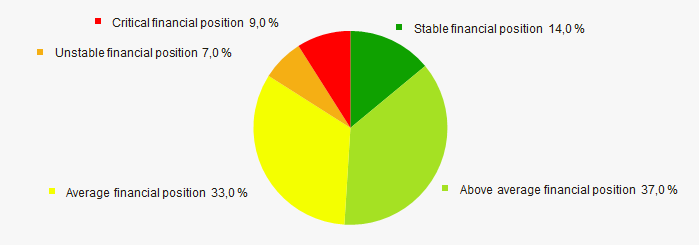 Picture 12. Distribution of TOP-100 companies by financial position score
Solvency index Globas
Most of TOP-100 companies got superior/high or strong/medium Solvency index Globas, this fact shows the ability of the companies to meet their obligations in time and fully (Picture 13).
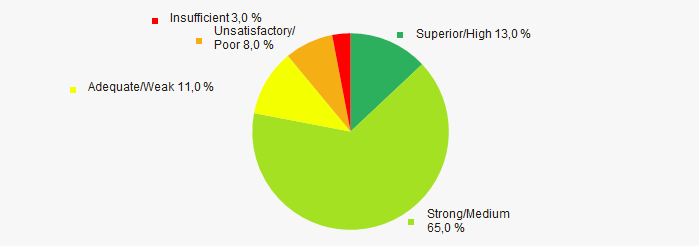 Picture 13. Distribution of TOP-100 companies by Solvency index Globas
According to the Federal Service of State Statistics, the share of enterprises in total revenue from sale of goods, products, works and services within country amounted to 0,061% in 2018 and 0,093% for 9 months of 2019, which is higher than the figure for the same period in 2018 (0,062%).
Conclusion
A complex assessment of the largest Russian gambling organizations, taking into account the main indexes, financial ratios and indicators, demonstrates the presence of positive trends (Table 1).
| Trends and assessment factors | Relative share, % |
| Growth/drawdown rate of average net assets value |  10 10 |
| Increase / decrease in the share of enterprises with negative net assets |  10 10 |
| The level of competition / monopolization |  -10 -10 |
| Growth/drawdown rate of average revenue |  10 10 |
| Growth/drawdown rate of average net profit (loss) |  10 10 |
| Increase / decrease in average net profit |  10 10 |
| Increase / decrease in average net loss |  -10 -10 |
| Increase / decrease in average values of current liquidity ratio |  -5 -5 |
| Increase / decrease in average values of ROI ratio |  10 10 |
| Increase / decrease in average values of assets turnover ratio, times |  10 10 |
| Share of small and medium-sized businesses by revenue more than 20% |  -10 -10 |
| Regional concentration |  -10 -10 |
| Financial position (the largest share) |  10 10 |
| Dynamics of the share of the region's revenue in the total revenue of the Russian Federation |  10 10 |
| Solvency index Globas (the largest share) |  10 10 |
| Average value of factors |  3,7 3,7 |
 favorable trend (factor),
  unfavorable trend (factor).
Capital efficiency of lottery companies
Information agency Credinform presents ranking of the largest Russian gambling and lottery companies. Enterprises with the largest volume of annual revenue (TOP-10) were selected for the analysis, according to the data from the Statistical Register for the latest available periods (for 2016-2018). Then they were ranked by decrease in return on equity ratio (Table 1). The analysis was made on the basis of the data of the Information and Analytical system Globas.
Return on equity (%) – characterises productivity of equity of an enterprise and shows the amount of net profit per rouble of equity.
The higher the indicator is, the more effectively the company uses equity invested in the authorized fund. However, it shoud be taken into account that too high indicators exceeding average values in the economy or in the industry by several times, can demonstrate insignificant equity amount with relatively high amount of net profit.
For getting of the most comprehensive and fair picture of the financial standing of an enterprise it is necessary to pay attention to all combination of indicators and financial ratios.
| Name, INN, region | Revenue, billion RUB | Net profit (loss), billion RUB | Return on equity ratio, % | Solvency index Globas | |||
| 2017 | 2018 | 2017 | 2018 | 2017 | 2018 | ||
| 1 | 2 | 3 | 4 | 5 | 6 | 7 | 8 |
| JSC STATE SPORT LOTTERIES INN 7728795958 Moscow |
 34648,6 34648,6 |
 46078,1 46078,1 |
 374,6 374,6 |
 118,0 118,0 |
 1248563,33 1248563,33 |
 393423,33 393423,33 |
285 Medium |
| JSC TK CENTER INN 7715918994 Moscow |
 16645,2 16645,2 |
 18729,0 18729,0 |
 512,3 512,3 |
 7,7 7,7 |
 1707650,00 1707650,00 |
 25723,33 25723,33 |
262 Medium |
| LLC F.O.N. INN 9715010229 Moscow |
 9686,3 9686,3 |
 24091,3 24091,3 |
 1674,1 1674,1 |
 9271,2 9271,2 |
 279,01 279,01 |
 1545,19 1545,19 |
155 Superior |
| LLC NHU MANAGEMENT COMPANY INN 7714707736 Moscow |
 2458,8 2458,8 |
 1088,84 1088,84 |
 250,8 250,8 |
 717,0 717,0 |
 208,84 208,84 |
 597,01 597,01 |
177 Superior |
| LLC FORTUNA INN 6164205110 Rostov region |
 18078,3 18078,3 |
 17315,3 17315,3 |
 48,5 48,5 |
 458,4 458,4 |
 45,70 45,70 |
 432,29 432,29 |
148 Superior |
| LLC FIRMA STOM INN 7705005321 Moscow |
 8557,7 8557,7 |
 20197,4 20197,4 |
 969,4 969,4 |
 380,6 380,6 |
 841,62 841,62 |
 330,42 330,42 |
158 Superior |
| LLC PMBK INN 7729607406 Moscow |
 11871,4 11871,4 |
 36115,7 36115,7 |
 20,2 20,2 |
 620,2 620,2 |
 7,33 7,33 |
 225,05 225,05 |
190 High |
| LLC LEON INN 7707760834 Moscow |
 664,3 664,3 |
 2304,5 2304,5 |
 0,1 0,1 |
 168,3 168,3 |
 0,04 0,04 |
 84,13 84,13 |
211 Strong |
| LLC G1 Entertainment INN 2502041903 Maritime territory |
 3522,5 3522,5 |
 3734,4 3734,4 |
 1283,9 1283,9 |
 755,8 755,8 |
 107,82 107,82 |
 63,47 63,47 |
236 Strong |
| SUNTORIN COMPANY LIMITED INN 4703069532 Saint Petersburg |
 10833,1 10833,1 |
 12191,8 12191,8 |
 -78,4 -78,4 |
 252,2 252,2 |
 -9,60 -9,60 |
 30,89 30,89 |
160 Superior |
| Average value for TOP-10 companies |  11696,6 11696,6 |
 19164,1 19164,1 |
 505,5 505,5 |
 1274,9 1274,9 |
 295769,41 295769,41 |
 42245,51 42245,51 |
|
| Average industrial value |  374,2 374,2 |
 632,8 632,8 |
 10,7 10,7 |
 40,0 40,0 |
 17,13 17,13 |
 61,34 61,34 |
|
 growth of indicator to the previous period,
  decrease of indicator to the previous period
Average value of the return on equity ratio of the TOP-10 group is higher than average industrial value. Six companies have improved their results in 2018.
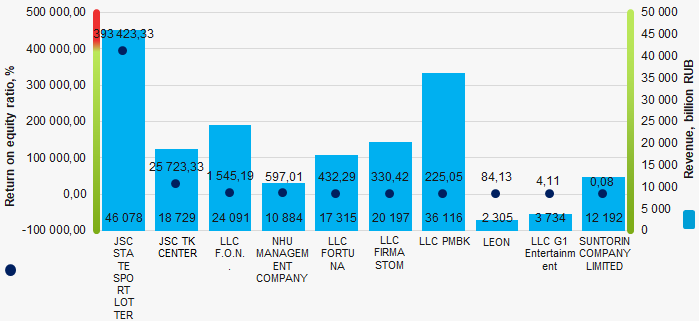 Picture 1. Return on equity ratio and revenue of the largest Russian gambling and lottery companies (TOP-10)
Over a ten-year period average industrial values of the return on equity ratio had increasing tendency. (Picture 2).
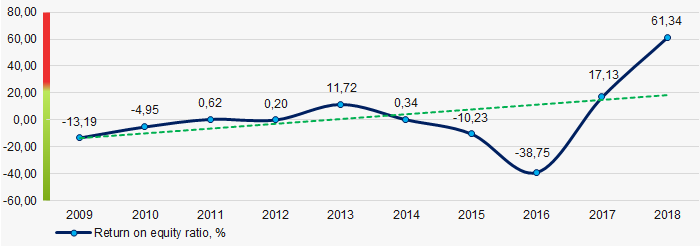 Picture 2. Change in the average industrial values of the return on equity ratio of Russian gambling and lottery companies in 2009 – 2018