Changes in legislation
Starting from 2022, companies from food service industry such as cafes, bars, restaurants, lunch counters, canteens, snack bars etc. are granted a privilege that exempt from VAT payment. It is provided by changes in parts one and two of the Tax Code of the Russian Federation, according to the Federal Law dated 02.07.2021 No 305-FZ.
Tax exempt is limited by three restrictions:
- Annual income should not be higher than 2 billion RUB, it is also an upper limit for the company to be considered as a small and medium-size enterprise;
- 70% of the sum should be received directly from the food service industry;
- salaries and wages of the staff should not be below the average for the region.
In addition, this Law exempts cultural institutions from advance payments of income tax, and regional small business support measures are not the subject to personal income tax and VAT.
Users of Globas have the opportunity to get all available information about all companies considered small businesses, including food service sector if they use “Filters” tool.
Small business in Saint Petersburg
The Government of Saint Petersburg has developed compensatory and recovery measures to support small and medium-sized companies in Saint Petersburg for 2022.
This may help increase the economic sustainability of small enterprises with negative activity trends for the past 5 years.
The most significant of them are: a decrease in the growth rate of average net assets, revenues and profits, an increase in the number of companies with negative net assets, an increase in net losses, and a decrease in profitability of investments and business activity.
Among positive trends are: an increase in the size of net assets, revenue and profit.
To conduct this analysis in Globas, the Information Agency Credinform has selected the largest companies in Saint Petersburg with the highest annual revenue (TOP 1000), according to the data from the Statistical Register and the Federal Tax Service for the latest available periods (2015 – 2020). The selected companies are registered in the Unified Register of Small and Medium-Sized Enterprises of the Federal Tax Service of the Russian Federation.
Net assets are total assets less total liabilities. This indicator reflects the real value of the property of an enterprise. When the company’s debt exceeds the value of its property, the indicator is considered negative (insufficiency of property).
The largest company in term of net assets is LLC AKTSEPT, INN 7801212360, investment in securities. In 2020, net assets value of the company exceeded 6 billion RUB.
The lowest net assets value among TOP 1000 belonged to JSC ADAMANT, INN 7826018614, rental and management of own or leased real estate. In 2020, insufficiency of property of the enterprise was indicated in negative value of -3,8 billion RUB.
Covering the five-year period, the average net assets values had a trend to increase with the decreasing growth rate (Picture 1).
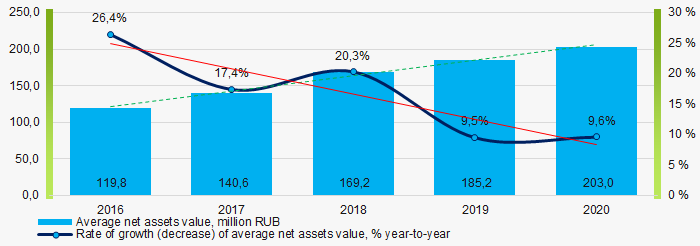 Picture 1. Change in average net assets values in 2016 – 2020
Over the past five years, the share of companies with insufficient property had a negative trend to increase (Picture 2).
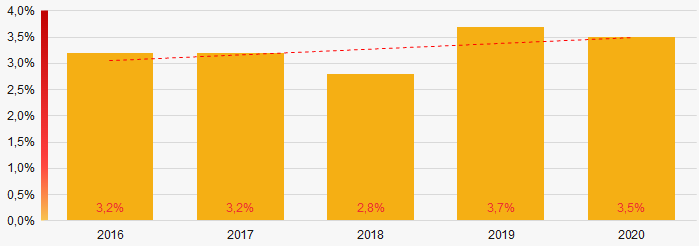 Picture 2. Shares of TOP 1000 companies with negative net assets value in 2016-2020
Sales revenue
The largest company in term of 2020 revenue is LLC ALARM-MOTORS-LAKHTA, INN 7814367593, retail sale of cars and passenger vehicles in specialized stores. The revenue amounted to 3,5 billion RUB.
Covering the five-year period, the average revenue values had a trend to increase with the decreasing year-to-year growth rate (Picture 3).
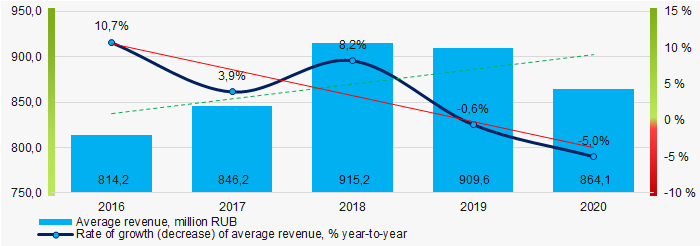 Picture 3. Change in average revenue in 2016 – 2020
Profit and loss
In 2020, the largest organization in term of profit was LLC MAVIS, INN 7805460162, activities of real estate agencies on a fee or contract basis. The company’s profit amounted to 995 million RUB.
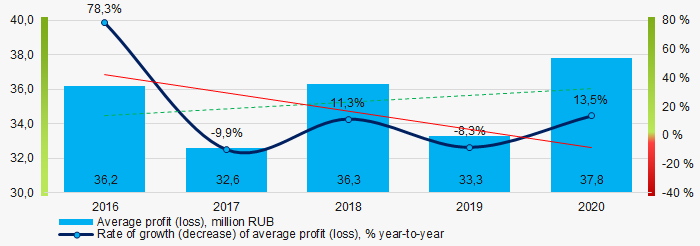 Picture 4. Change in average profit (loss) in 2016 – 2020
Covering the five-year period, the average values of net profit and net loss of TOP 1000 have multidirectional upward trends (Picture 5).
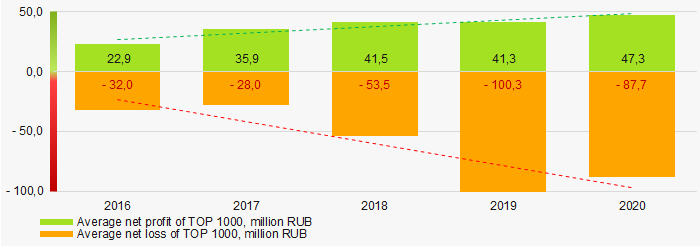 Picture 5. Change in average net profit (loss) values of TOP 1000 in 2016 – 2020
Key financial ratios
Covering the ten-year period, the average values of the current liquidity ratio were above the recommended ones - from 1,0 to 2,0 with a trend to increase (Picture 6).
Current liquidity ratio (current assets to short-term liabilities) shows the sufficiency of company’s assets to repay on short-term liabilities.
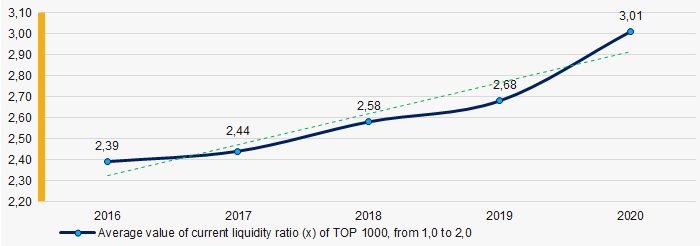 Picture 6. Change in industry average values of current liquidity ratio in 2016 – 2020
Covering the five-year period, the average values of ROI ratio had a trend to decrease (Picture 7).
ROI ratio is calculated as net profit to sum of shareholders equity and long-term liabilities, and shows the return of equity involved in commercial activities and long-term borrowed funds.
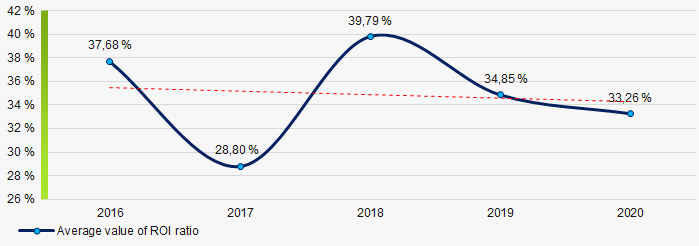 Picture 7. Change in industry average values of ROI ratio in 2016 - 2020
Assets turnover ratio is the ratio of sales revenue and company’s average total assets for a period. It characterizes the effectiveness of using of all available resources, regardless the source of their attraction. The ratio shows how many times per year the full cycle of production and circulation is performed, generating the corresponding effect in the form of profit.
Covering the five-year period, the downward trend was observed for this ratio (Picture 8).
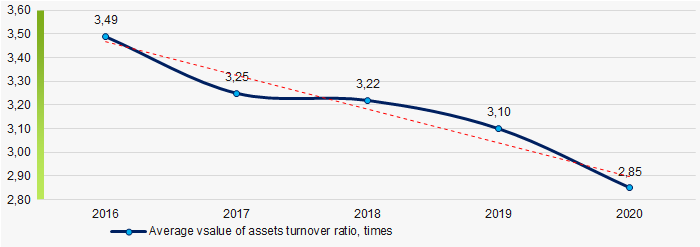 Picture 8. Change in average values of assets turnover ratio of TOP 1000 in 2016 – 2020
Small business
Of all the companies registered in the Unified Register of Small and Medium-Sized Enterprises of the Federal Tax Service of the Russian Federation, medium-sized enterprises have the largest share in the total revenue of TOP 1000 in 2020 (Picture 9).
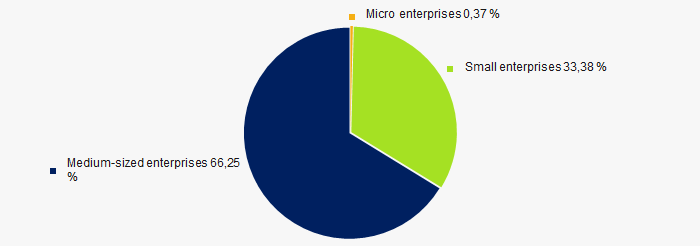 Picture 9. Shares of small and medium-sized enterprises in TOP 1000
Financial position score
Assessment of the financial position of TOP 1000 companies shows that the majority of them have financial position above average (Picture 10).
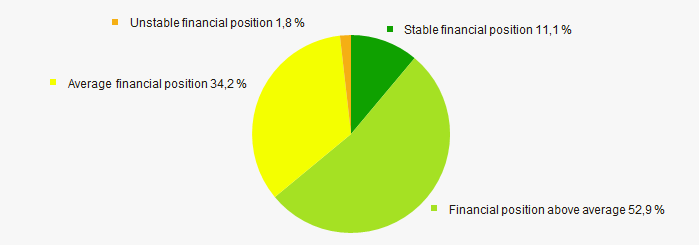 Picture 10. Distribution of TOP 1000 companies by financial position score
Solvency index Globas
Most of TOP 1000 companies got Superior / High and Strong / Medium indexes Globas. This fact shows their limited ability to meet their obligations fully (Picture 11).
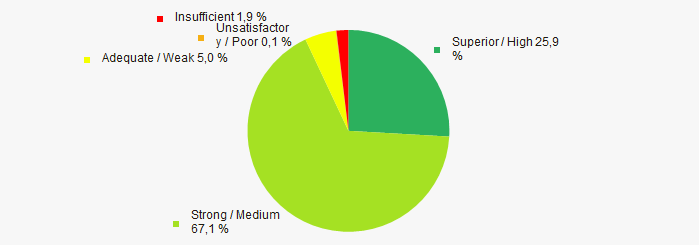 Picture 11. Distribution of TOP 1000 companies by solvency index Globas
Conclusion
Complex assessment of activity of small business in Saint Petersburg shows the prevalence of negative trends in their activities in 2016 - 2020 (Table 1).
| Trends and evaluation factors | Relative share of factors, % |
| Dynamics of the average net assets value |  10 10 |
| Rate of growth (decrease) in the average size of net assets |  -10 -10 |
| Increase (decrease) in the share of enterprises with negative values of net assets |  -10 -10 |
| Dynamics of the average revenue |  10 10 |
| Rate of growth (decrease) in the average size of revenue |  -10 -10 |
| Dynamics of the average profit (loss) |  10 10 |
| Rate of growth (decrease) in the average profit (loss) |  -10 -10 |
| Growth / decline in average values of companies’ net profit |  10 10 |
| Growth / decline in average values of companies’ net loss |  -10 -10 |
| Increase / decrease in average values of total liquidity ratio |  5 5 |
| Increase / decrease in average values of return on investment ratio |  -10 -10 |
| Increase / decrease in average values of asset turnover ratio, times |  -10 -10 |
| Financial position (the largest share) |  10 10 |
| Solvency index Globas (the largest share) |  10 10 |
| Average value of relative share of factors |  -0,4 -0,4 |
 positive trend (factor),
  negative trend (factor)