Preliminary results of the first stage of 2016 agricultural census
In 2016 the second in new Russian history agricultural comprehensive census is conducted in two stages. The first stage was taken in the most regions of the country from 1 July to 15 August. The second stage was taken from 15 September to 15 November in far and isolated regions, which are difficult to reach. It is required to collect information about almost 300 agricultural organizations, 795 peasant farm enterprises and 25 th private farms on these territories.
Census operation is regulated by the Decision of the Government of the Russian Federation № 316 of April 10, 2013, which identifies its major goals:
- to form official statistics data about main agricultural production indicators, condition and structure of agricultural sector of economy;
- to collect information about availability and actual use of agricultural resources;
- to get detailed features of agricultural entities;
- to compile data about municipal entities;
- to increase the data bank for international comparison.
The operational research results of the first stage of census show, that on the vast majority of the country it was managed to collect detailed statistics data about 36 400 agricultural entities, 174 800 peasant farm enterprises and individual entrepreneurs, 18 200 000 private and personal subsidiary husbandries and 76 300 nonprofit associations of citizens.
Thus the share of researched subjects, which transferred data in electronic form, among agriculture entities amounted to 26,8%, among micro entities - 11,7%, among subsidiary husbandries of nonagricultural entities - 13,2%.
0,2% of the researched subjects among personal subsidiary husbandries refused to provide information for the census, as well as 0,01% of peasant farm enterprises, 0,03% of horticultural, vegetable and garden plots owners, 0,04% of individual entrepreneurs.
According to experts, the main outcome of the first and main stage of the census is specification of the general totality of agricultural units. In the future it will allow to improve the current agricultural statistics, that, accordingly, will positively influence on the process of agricultural management and effectiveness of its state support.
The primary analysis of the collected data indicates about significant structural shifts, i.e. decrease in agricultural manufacturers and increase in farms area. This allows to apply modern production technologies and reduces employment in agriculture, but at the same time the decrease in the number of rural settlements and higher migration flow to cities take place.
The Federal State Statistics Service will start to sum up the final results of the census after the completion of its second stage. It is planned to present the preliminary results in October – November 2017. The final results will be published from May to December 2018.
Solvency ratio of the largest Russian enterprises, mining precious and non-ferrous metal ores
Information agency Credinform prepared a ranking of the largest Russian enterprises, mining precious and non-ferrous metal ores.
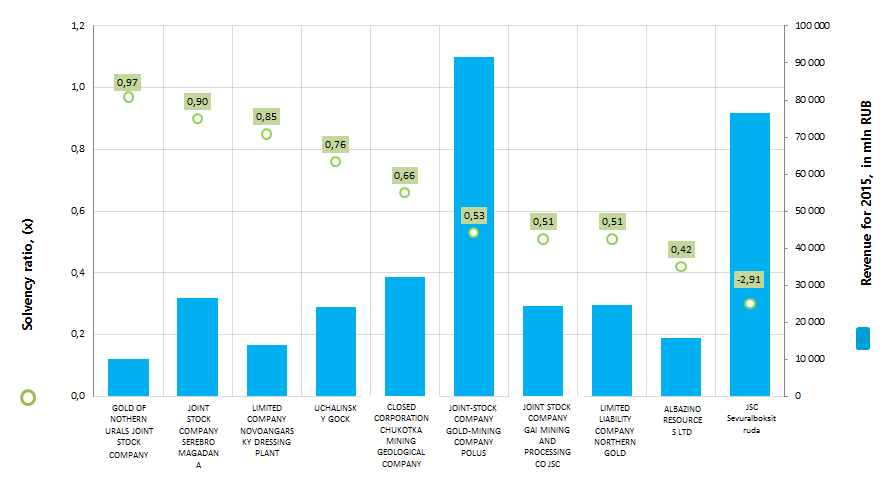
The enterprises, mining precious and non-ferrous metal ores, with the highest volume of revenue (TOP-10) were selected for the ranking, according to the data from the Statistical Register for the latest available accounting period (for the year 2015). Then the companies were ranked by decrease in solvency ratio (Table 1).
Solvency ratio (х) is calculated as a relation of equity capital to total assets and characterizes the company's dependence on external loans. Recommended value of the ratio is: > 0,5.
The ratio value below the minimum recommended limit means a high dependence on external sources of financing. By the worsening of conjecture in the market it may lead to liquidity crisis and to unstable financial position.
For getting of the most comprehensive and fair picture of the financial standing of an enterprise it is necessary to pay attention to all available combination of ratios, financial and other indicators.
| Name, INN, region | Net profit for 2015, in mln RUB | Revenue for 2015, in mln RUB | Revenue for 2015 by 2014, % | Solvency ratio, (х) | Solvency index Globas-i |
|---|---|---|---|---|---|
| GOLD OF NOTHERN URALS JOINT STOCK COMPANY INN 6617001534 Sverdlovsk region |
5 660,0 | 10 140,6 | 90 | 0,97 | 208 High |
| JOINT STOCK COMPANY SEREBRO MAGADANA INN 4900003918 Magadan region |
11 294,4 | 26 627,8 | 142 | 0,90 | 219 High |
| LIMITED COMPANY NOVOANGARSKY DRESSING PLANT INN 2426003607 Krasnoyarsk territory |
5 250,6 | 13 906,6 | 112 | 0,85 | 162 The highest |
| UCHALINSKY GOCK INN 0270007455 Republic of Bashkortostan |
3 300,7 | 24 151,9 | 127 | 0,76 | 204 High |
| CLOSED CORPORATION CHUKOTKA MINING GEOLOGICAL COMPANY INN 8709009294 Chukotka Autonomous Region |
10 214,7 | 32 335,5 | 87 | 0,66 | 189 The highest |
| JOINT-STOCK COMPANY GOLD-MINING COMPANY POLUS INN 2434000335 Krasnoyarsk territory |
37 827,5 | 91 691,6 | 152 | 0,53 | 183 The highest |
| JOINT STOCK COMPANY GAI MINING AND PROCESSING CO JSC INN 5604000700 Orenburg region |
2 185,1 | 24 511,0 | 141 | 0,51 | 228 High |
| LIMITED LIABILITY COMPANY NORTHERN GOLD INN 8706005044 Chukotka Autonomous Region |
11 227,1 | 24 707,0 | 191 | 0,51 | 246 High |
| ALBAZINO RESOURCES LTD INN 2721128498 Khabarovsk territory |
4 163,4 | 15 724,1 | 136 | 0,42 | 247 High |
| JSC Sevuralboksitruda INN 6631001159 Sverdlovsk region |
5 618,0 | 76 472,8 | 200 | 0,30 | 263 High |
The average value of the solvency ratio in the group of TOP-10 largest enterprises, mining precious and non-ferrous metal ores, was 0,64 in 2015 against 0,60 in 2014. The same index in the group of TOP-100 companies made 0,42 in 2014, by industry average value of 0,48.
Recline in solvency ratio in 2015 compared with the previous year is observed by UCHALINSKY GOCK, JOINT-STOCK COMPANY GOLD-MINING COMPANY POLUS and JOINT STOCK COMPANY GAI MINING AND PROCESSING CO JSC.
ALBAZINO RESOURCES LTD and JSC Sevuralboksitruda did not meet the recommended standard of the ratio as well in 2014 as in 2015. By this the second company showed the maximum growth in revenue in 2015 in regard to 2014 in the group of TOP-10 companies. The decrease in revenue for this period was by GOLD OF NOTHERN URALS JOINT STOCK COMPANY and CLOSED CORPORATION CHUKOTKA MINING GEOLOGICAL COMPANY.
Though, on the combination of financial and non-financial indicators, all enterprises got the highest or high solvency index Globas-i, that indicates their ability to repay their debts in time and fully.

The total revenue of the TOP-10 companies reached 340,3 billion rubles in 2015, that is by 42% more than in 2014. At the same time the total net income in 2014 and in 2015 increased more than twice in relation to the corresponding previous periods.
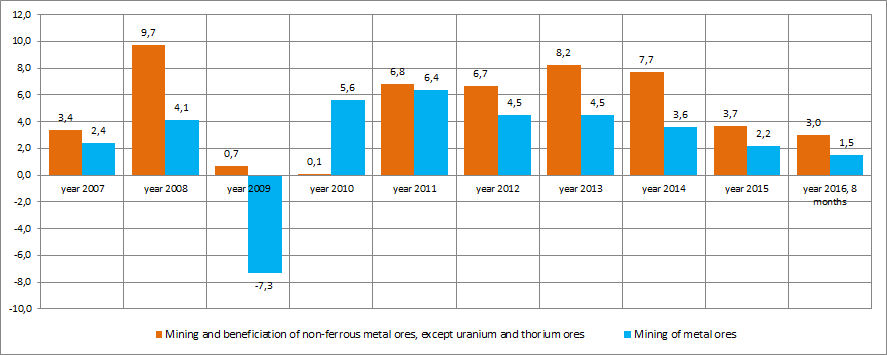
In general, the enterprises of TOP-10 and TOP-100 groups demonstrate a high enough independence on external sources of funds. However, the discernible trend to a decrease in the level of production is observed in this industry recently. This is as evidenced by the data of the Federal State Statistics Service (Rosstat) (Picture 2).

The enterprises, mining precious and non-ferrous metal ores, are distributed across country's regions unequal and biased to the corresponding mineral fields. Thus, according to the data of the Information and analytical system Globas-i, 100 the largest companies on the volume of revenue for 2014 are registered in 22 regions. The greatest number of them is registered in the regions shown in Table 2.
| Region | Number of companies |
|---|---|
| Republic of Sakha (Yakutia) | 13 |
| Magadan region | 11 |
| Irkutsk region | 10 |
| Krasnoyarsk territory | 9 |
| Khabarovsk territory | 8 |
| Chukotka Autonomous Region | 7 |
| Amur region | 6 |
| Sverdlovsk Region | 6 |
| Kamchatka territory | 4 |
| Republic of Bashkortostan | 4 |
Thus, 78% of the largest companies of this industry are concentrated in 10 regions of the country.