Herald
Isolation of Russia is canceled

Dear Madams and Sirs,

In spite of the significant cooling in relations with the Occident, EU states coalition remains the main foreign trade partner of Russia. 48,2% of trade in monetary terms (377,4 bln US Dollars) has fallen to its share in 2014. Remarkably, Russia is the third by importance for EU for that matter after China and the USA.

However, sanctions war and stagnation of the Russian economy have resulted in reduction of the total turnover value with EU by 9,6%.

In general, the trade volume of Russia with other countries amounted to 783,5 bln US Dollars in 2014, that is 7% lower than in 2013 (842,2 bln Dollars in 2013; maximum for the whole post-Soviet period). 239 countries and territories were involved in export-import operations with Russia.

Import for the period under review has reduced more than the Russian export: import by 9,2% and export by 5,6%. In monetary terms import amounted to 285,9 bln US Dollars, export to 497,6 bln US Dollars.

The main reason of import reduction was devaluation of the rouble in the whole 2014, as well as falling demand. It will be difficult to replace the drop-down import: devaluation and import falling during the 1998 crisis had speeded up domestic enterprises by means of previously unused capacities, but now this resource is limited.

Referring to the rating of the most important trade partners excluding commercial unions. China takes the first place (88,4 bln US Dollars), Netherlands takes the second (73,3 bln US Dollars), and Germany is the third (70,1 bln US Dollars).

External turnover with the neighboring Ukraine fell by 29,6% (to 27,9 bln US Dollars). The negative trend of indexes rapid reduction will clearly continue in 2015. Despite of imposed sanctions, trade with the USA has increased by 5,5% in 2014 (up to 29,2 bln US Dollars).

Table 1. Foreign trade volume of the RF and main foreign trade partner countries (Top-15) in 2014
Partner countries Foreign trade volume of the RF for 2014, bln US Dollars Increase (reduction) comparing to 2013, % Share of external turnover to the total, %
  Total 783 453,7 -7,0 100
  EU 377 390,5 -9,6 48,2
1 China 88 373,4 -0,5 11,3
2 Netherlands 73 284,0 -3,5 9,4
3 Germany 70 087,6 -6,5 8,9
4 Italy 48 471,2 -10,0 6,2
5 Turkey 31 620,3 -3,4 4,0
6 Belarus 31 511,3 -7,8 4,0
7 Japan 30 793,9 -7,3 3,9
8 USA 29 146,2 5,5 3,7
9 Ukraine 27 862,3 -29,6 3,6
10 South Korea 27 300,2 8,5 3,5

At the same time Russia has begun phased trade flow redistribution to Asian, African and Latin American countries. Among the main partner countries with total turnover of more than 3 bln dollars, Singapore is on top (see table 2) in term of its growth (+152,5% to 2013); Egypt takes the second place (+86%).

Table 2. Partner countries (Top-10) in term of developing of mutual trade with the RF (foreign trade volume exceeds 3 bln US Dollars) in 2014.
Partner countries Growth of foreign trade volume of the RF to 2013, % Foreign trade volume, mln US Dollars
1 Singapore 152,5 6 156,2
2 Egypt 86,0 5 478,7
3 Denmark 23,2 4 506,9
4 Malaysia 22,7 3 297,0
5 Latvia 19,8 13 450,4
6 Thailand 18,7 3 986,5
7 Brazil 15,7 6 335,5
8 Azerbaijan 12,0 4 009,1
9 Estonia 10,7 5 326,9
10 Belgium 8,8 12 798,7

The structure of the Russian export remains uniform and is based on depleting resources. Excluding oil and gas the country imports ferrous metals (4,1% of total export in monetary terms), precious and semiprecious stones, pearl (2,4%), hi-tech equipment for nuclear power industry (1,9%), fertilizers (1,8%), weapons (1,8%), wood (1,6%), products of chemical industry (1,5%), cereals (1,4%), aluminum (1,3%) and other items (12,7%).

Decline Isolation Russia

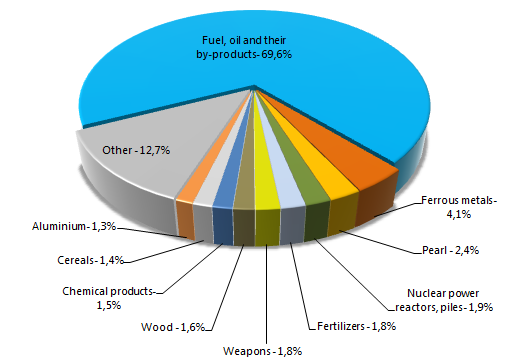
Figure 1. Structure of the Russian export in monetary terms, 2014, %

The structure of the Russian import is not so uniform. Russia purchases a wide range of products, mainly equipment for power industry (18,2% of total import in monetary terms), electrical machinery and equipment (11,8%), lorries and cars (11%), medicines (4,5%), plastics (3,8) and other (see figure 2).

Decline Isolation Russia

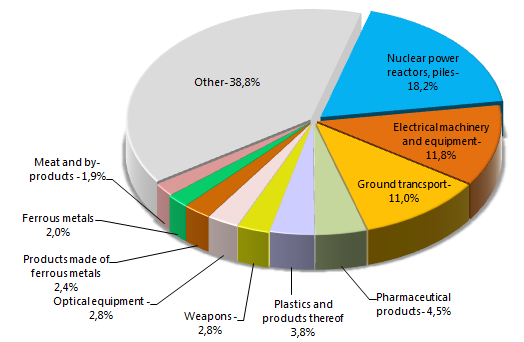
Figure 2. Structure of the Russian import in monetary terms, 2014, %

According to the experts of the Credinform information agency, the reduction of foreign trade volume will continue next year, but as a temporary thing. Growth recovery in 2016 will be possible at exchange and economic climate stabilization and greater credit resources access. Today Russia finds new trade partners and discovers new markets, despite of external constraints. Isolation, being discussed by some Western countries’ leaders, doesn’t happen.

For all information on Russian and foreign enterprises, as well as analytical reports on various economic sectors you can refer to our Custom Service Department specialists:

+7 (812) 406 8414 (Saint-Petersburg), +7 (495) 640 4116 (Moscow).

Herald
Inequality of Russian regions

Dear Madams and Sirs,

Russian regions are quite unequal by the area, population, resources potential, scientific-industrial and trade resources, and social-economic development level. For their comparison various methods and rankings using the set of assessments and the specific feature for ranking were created. Therefore it is interesting to study the territorial entities of Russia in term of ratio of the expenditure regional budget to the population.

Most of the territory of the Russian Federation has the dotation status and treasuries more or less depend on inter-budget transfers from the federal center. The government policy is aimed at fiscal equalization of regional development inequality, which remains to be very high. By far, first spots of the ranking of the regions in terms of budget sufficiency belong to the High North regions rich with natural resources being our export base, as well as economic and political centers – Moscow and Saint-Petersburg.

The Nenets Autonomous District with the population of just over 40 th. people is on top. The expenditure budget of the district is compared with the budget of the Mari El Republic with almost 700 th. people. The district has 425 th. RUB account for head per year, while it is less in the Mari El Republic with its 32 th. RUB for head per year.

Despite of such a high level of the expenditure budget per head, life is very expensive in the Nenets Autonomous District. Moreover, extremely sever climatic conditions and underdeveloped infrastructure are resulted in high migration outflow of the most mobile citizens groups and natural population reduction (except autonomous districts of the Tyumen region). For example, the population of the Magadan region (5th in the ranking) has reduced by 3,7 in the period of 1989 – 2015 (from 542,9 th. to 148,1 th. people). In spite of the quite high living standard, the living attraction of this territory remains extremely low.

Among all regions of Russia, Moscow is reasonably the most attractive place for living both by climatic and social-economic conditions. The capital of Russia with the expenditure budget of 134 th. RUB per head is the 8th in the ranking, having at the same time the largest population among all 85 regions (12,2 mln. people).

Migratory pressure in the Moscow region will remain until neighboring regions approach the city by development. As a comparison, the expenditure budget per head in the Kaluga region is less than in Moscow by 2,9 times. Leveling the imbalance have to be conducted not only by manufacturing and service sector development, but also by changing the rules of business registration - at the place of main activity carrying out. The example is that almost all major fuel and energy companies of Russia are registered in Moscow and Saint-Petersburg, but operate far beyond them. The number of legal entities in both cities is an indirect proof: according to the Information and analytical system Globas®-i of the Credinform information agency, 1102,2 th. legal entities operate in Moscow and 357,6 th. in Saint-Petersburg; that is about 31% of all active enterprises in the country.

Whereas Saint-Petersburg closes the top 10 of the ranking – 91 th. RUB per head. Despite a slight growth of the expenditure budget in 2015, the positive population changes have resulted in spending reduction per head (-0,6%).

The lowest indicators were traditionally recorded in the regions of North Caucasus: the Republics of Dagestan and North Ossetia-Alania with 28 th. RUB per head.

Budgets of the Republic of Crimea and Sevastopol have shown the most impressive growth of the expenditure part due to the federal subsidies: by 230% and 102% respectively (this can be explained by the low base of the previous period, when the treasury was formed as a part of the Ukraine). Sevastopol is 35th and the Republic of Crimea is 57th in the ranking, which is higher than the Krasnodar Territory.

Table. The expenditure budget and regional fiscal capacity, 2015
(full version of the table is available in our website)
Rang Territorial entity The expenditure budget 2015 (at the time of adoption), th. RUB The expenditure budget for head per year, th. RUB Growth (reduction) of the expenditure budget indicator per head to 2014, %
1 The Nenets Autonomous District 18 438 763 425 49,8
2 The Chukotka Autonomous District 21 031 142 416 15,8
3 The Sakhalin region 129 900 383 266 13,5
4 The Yamal-Nenets Autonomous District 117 249 240 217 8,3
5 The Magadan region 27 736 321 187 -2,0
... ... ... ... ...
81 The Karachayevo-Cherkessian Republic 13 731 547 29 -1,2
82 The Republic of Kalmykia 8 129 643 29 3,9
83 The Saratov region 72 063 925 29 1,2
84 The Republic of North Ossetia-Alania 19 928 645 28 -2,5
85 The Republic of Dagestan 84 346 884 28 4,0

Significant inequality in regional development remains in Russia: the difference of the expenditure budget per head among the territories is 15 times. The existing tax allocation system has led to the appearance of several donator regions, while the majority of territories annually obtain donations from the federal budget to flow balance; that results in the reduction of economic growth initiative.

You can obtain all available information on enterprises in different regions of the Russian Federation from daily updating Information and analytical system Globas-i®. For all information on Russian and foreign enterprises, as well as analytical reports on various economic sectors you can refer to our Custom Service Department specialists:

+7 (812) 406 8414 (Saint-Petersburg), +7 (495) 640 4116 (Moscow).