
Order a report
Custom-made industry research, company ratings, competitor analysis


Less is better. FTS continues to strike shell companies off EGRUL
Process of reduction of active legal entities being unexampled on a scale is conducting in Russia for two consecutive years: following the results of 2017, the number of active legal entities in Russia reduced by 183 th – to 4 371 th companies. Totally for 2016-2017 almost half a million on one in ten company were removed from EGRUL. It is the first time for the entire time of conducting centralized statistics of legal entities registration when such a result was obtained.
The number of operating companies in 2017 is compatible to eight years ago figures, and the negative dynamics of legal entities registration should be expected in mid-term (see Picture 1).
At first sight, the reason of legal entities reduction is of economic nature: poor demand for several years is resulted in slowdown and ultimately closing of an enterprise. However, relatively few companies in Russia are liquidated after bankruptcy proceedings – about 10 th per year or 0,7% of total ceased companies. The statistics is near the same level without any significant positive or negative changes.
The main reason is striking “paper” and “abandoned” companies off EGRUL by decision of the registering authority – 547 th or 84,4% of total cases of liquidation in 2017 (see Picture 3).
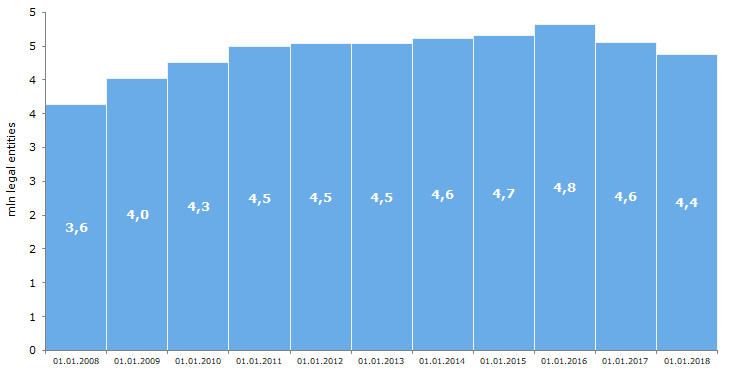 Picture 1. Number of operating legal entities
647 th legal entities were liquidated and 454 th were established in 2017. Excess of liquidated legal entities over established ones is 43% (see Picture 2). Over the entire EGRUL history, the highest number of liquidated companies was recorded in 2016 – 781 th. At the same time, there is no positive trend in new companies’ establishment.
Totally 1,4 mln companies ceased activities om 2016 – 2017 that is compatible to four previous years 2012 – 2015 (1,6 mln legal entities).
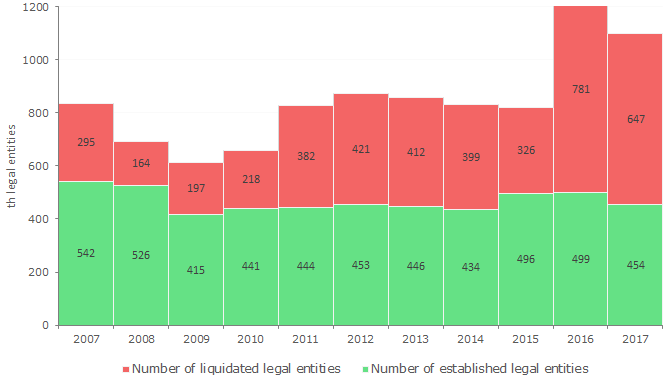 Picture 2. Number of established and liquidated legal entities, per year
Number of companies ceased activities after reorganization reduced in 2,5 times (from 48 th to 20 th) in 2017. When reorganizing the proprietor is obliged to prove the company has passed tax audit and has no debts. When the company starts to reorganize, tax authorities begin to check legal address and the company’s reality. That is why shell companies reject “alternative” form of liquidation through reorganization.
In 2017, the FTS has got the right to remove companies in case of record on false data in EGRUL, if the company does not provide true information within 6 months. Totally 550 th records were entered the register for the previous year.
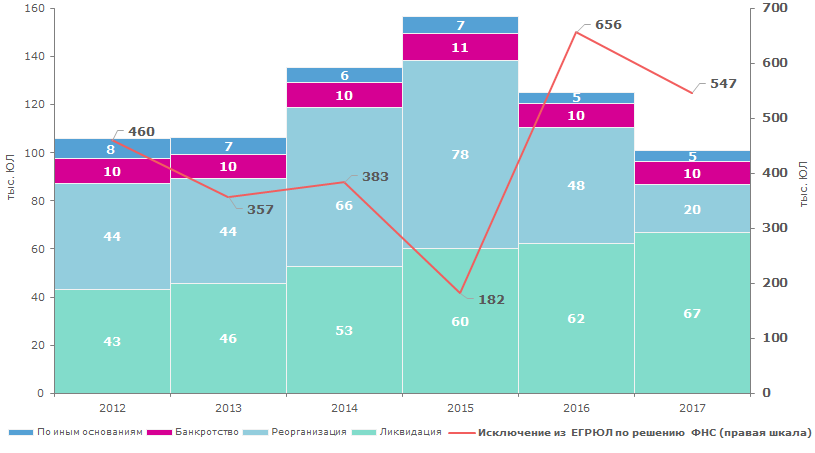 Picture 3. Dynamics of reasons for cessation of legal entities activity in Russia by years
The majority of legal entities are registered in Moscow – 938,8 th; 337,9 th in Saint-Petersburg and 229,2 th in Moscow region. The share of these three subjects in total number of companies in Russia is 34,4%. The first 10 regions together accumulates 53% companies in Russia.
| Rank | Region | Number of registered legal entities as of 01.01.18 | Share in total number of registered legal entities, % |
| 1 | Moscow | 938 783 | 21,5 |
| 2 | Saint-Petersburg | 337 913 | 7,7 |
| 3 | Moscow region | 229 222 | 5,2 |
| 4 | Sverdlovsk region | 149 188 | 3,4 |
| 5 | Krasnodar territory | 139 698 | 3,2 |
| 6 | Novosibirsk region | 118 886 | 2,7 |
| 7 | Republic of Tatarstan | 113 470 | 2,6 |
| 8 | Samara region | 104 948 | 2,4 |
| 9 | Chelyabinsk region | 95 585 | 2,2 |
| 10 | Nizhny Novgorod region | 91 996 | 2,1 |
| – | Total for Top-10 | 2 319 689 | 53 |
| – | Total | 4 371 335 | 100 |
In absolute terms the highest decrease in number of legal entities for 2017 was registered in the Republic of Tatarstan – minus 13 th. Then follows Sverdlovsk region and Moscow – minus 12 th. As a reminder, there was a decrease by 172 th companies in 2016 when Moscow was absolute leader in shell companies liquidation. Nowadays the FTS conducts removal in regions.
Speaking about relative figures, Khanty-Mansi autonomous district – Yugra sustained the highest losses of 14% of total legal entities.
Sevastopol and the Republic of Crimea demonstrates increase in legal entities both in absolute and relative terms. It is connected with entering the territories into the Russian Federation and re-registration of local companies.
| Rank | Region | Increase / decrease of legal entities to 1.01.17, % | Region | Increase / decrease of legal entities to 1.01.17, pcs. |
| 1 | Sevastopol | 6,5 | Republic of Crimea | 4 369 |
| 2 | Republic of Crimea | 3,7 | Belgorod region | 1 738 |
| 3 | Belgorod region | 3,1 | Sevastopol | 832 |
| 4 | Chukotka autonomous district | 2,2 | Smolensk region | 750 |
| 5 | Smolensk region | 2,0 | Tyumen region | 134 |
| ... | ... | ... | ... | ... |
| 81 | Republic of North Ossetia-Alania | -11,0 | Nizhny Novgorod region | -9 164 |
| 82 | Vologda region | -11,5 | Saint-Petersburg | -11 281 |
| 83 | Republic of Mari El | -11,7 | Moscow | -11 472 |
| 84 | Republic of Khakassia | -12,5 | Sverdlovsk region | -11 722 |
| 85 | Khanty-Mansi autonomous district - Yugra | -13,6 | Republic of Tatarstan | -12 880 |
Rapid decrease in the number of legal entities in Russia is not resulted from slackening of economic activity, but from the FTS policy of striking «paper» companies off EGRUL. Business community was waiting for targeted measures concerning registration of companies working on paper alone, as well as curtailing of business schemes for tax evasion or fraudulent transactions.
On the background of active struggle against shell companies, it is necessary to clarify the idea of possibility of registering a legal entity without legal address (office) on the basis of a mail box or electronic service approved in January 2018 by the Presidium of the President's Council for Strategic Development and Priority Projects chaired by the prime minister Dmitry Medvedev. Initiative is promoted within the frameworks of virtual economy formation. According to Maxim Oreshkin, Minister for Economic Development, related amendments could come into force this year.
The proposal contravenes current practice of the FTS considering physical absence of the company or its executive at the address specified in EGRUL as one of the signs of shell company. Monitor the situation through news on Credinform.