
Order a report
Custom-made industry research, company ratings, competitor analysis


Return on sales ratio of the largest Russian pharmaceutical wholesale distributors
Information agency Credinform has prepared a ranking of the largest Russian pharmaceutical wholesale distributors. The enterprises with the highest volume of revenue (TOP-10) have been selected for the ranking, according to the data from the Statistical Register for the latest available accounting periods (2015 and 2014) (TOP-10). Then they have been ranked by the 2015 return on sales ratio (Table 1).
Return on sales (%) is the share of operating profit in the total sales volume of the company. The return on sales ratio represents the efficiency of the company’s industrial and commercial activity and shows its funds that remained after having covered the cost of production, loan interest and tax payments.
The variety of values of return on sales of companies within one sector is determined by the difference in competitive strategies and product lines. Thus, having the same value of revenue, operation costs and earnings before tax, two different companies may have different return on sales due to the ratio of interest to the net profit.
The calculation of practical values of financial ratios, which might be considered as normal for a certain industry, has been developed and implemented in the Information and Analytical system Globas® by the experts of Information Agency Credinform, having taken into account the current situation in the economy as a whole and in the industries. The practical value of the return on sales ratio for pharmaceuticals wholesalers starts from 4,87.
For the most comprehensive and objective opinion on the company’s financial position, the whole set of financial indicators and ratios should be taken into account.
| Name, INN, region | 2015 net profit, mln RUB | 2015 revenue, mln RUB | 2015/ 2014 revenue,% | 2015 return on sales, % | Solvency index Globas® |
| NJSC SANOFI RUSSIA INN 7705018169 Moscow | 2 936,4 | 47 476,6 | 2,8 | 17,87 | 181 The highest |
| JOHNSON & JOHNSON LIMITED LIABILITY COMPANY a159-c4e0f0d3187f INN 7725216105 Moscow | 3 277,7 | 46 715,1 | 7,2 | 13,93 | 191 The highest |
| NJSC BAYER INN 7704017596 Moscow | 508,0 | 41 126,2 | 21,6 | 6,19 | 229 High |
| JOINT STOCK COMPANY SCIENTIFIC PRODUCTION COMPANY KATREN INN 5408130693 Novosibirsk Region | 5 790,7 | 182 301,6 | 26,7 | 4,17 | 187 The highest |
| FARMPERSPEKTIVA LLC INN 6312050583 Kaluga region | 174,4 | 31 422,1 | 51,4 | 3,17 | 223 High |
| NJSC ROSTA INN 7726320638 Moscow region | 415,3 | 63 384,6 | -12,8 | 2,76 | 201 High |
| НNJSC CV PROTEK FIRM INN 7724053916 Moscow | 5 419,7 | 166 578,3 | 25,8 | 1,55 | 197 The highest |
| FK PULS LLC INN 5047045359 Moscow region | 2 150,9 | 92 038,1 | 67,3 | -0,60 | 188 The highest |
| PHARM-LOGISTIC LLC INN 7727692420 Moscow | -683,9 | 35 408,8 | -12,2 | -0,68 | 400 Low |
| NJSC SIA INTERNATIONAL LTD INN 7714030099 Moscow | -3 111,1 | 59 438,2 | -39,7 | -4,10 | 300 Satisfactory |
| Total for TOP-10 group of companies | 16 878,1 | 765 889,5 | |||
| Average value within TOP-10 group of companies | 1 687,8 | 76 588,9 | 11,5 | 4,43 | |
| Industry average value | 6,1 | 187,6 | 2,0 | 4,87 |
The average value of the 2015 return on sales ratio in TOP-10 group of companies is lower than practical value. Three companies of TOP-10 group of companies have a negative value of the ratio, four companies have a lower value, and three have a value that is higher than the practical one (red, yellow and green highlight respectively, in Table 1 and Picture 1).
Four companies of TOP-10 group decreased their revenue and net profit indicators (having loss) in 2015 as compared to the prior period (red highlight in Table 1).
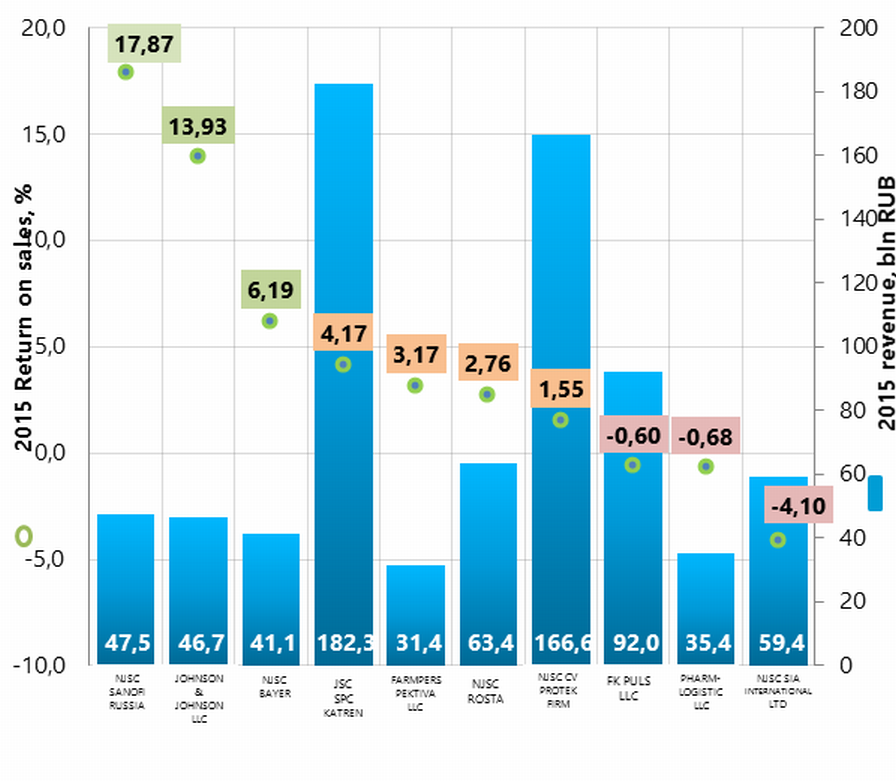 Picture 1. Return on sales ratio and revenue of the largest Russian pharmaceuticals wholesalers (TOP-10)
 Industry average values of the return on sales ratio (Picture 2) represent the macroeconomic situation in general, with declines during crisis periods.
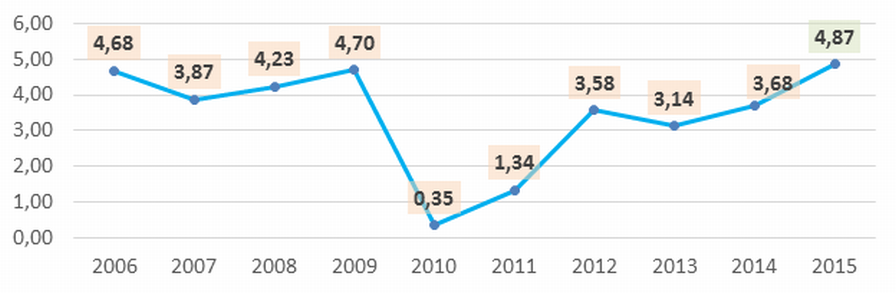 Picture 2. Industry average values of the return on sales ratio of the largest Russian pharmaceuticals wholesalers in 2006 – 2015
 Eight of TOP-10 companies got the highest or high solvency index Globas® that demonstrates their ability to pay their debts in time and fully.
PHARM-LOGISTIC LLC got a low solvency index Globas®, due to information concerning a bankruptcy claim against the company. In this regard, one is to expect the results of the case hearing. In addition to this, there are cases of late debt performance, unclosed writs of execution and loss within the balance sheet structure. Index development trends are negative.
NJSC SIA INTERNATIONAL LTD got a satisfactory solvency index Globas®, due to information concerning the company being a defendant in debt collection arbitration proceedings, untimely fulfillment of obligations and unclosed writs of execution. Index development trends are stable.