
Order a report
Custom-made industry research, company ratings, competitor analysis


Coal mining trends
The last UN Climate Change Conference (COP26) ended with the adoption of compromise documents. Previously, it was planned to fix the wording on the phase-out of energy obtained from coal. However, only a "phased reduction" is recorded in the final text. This indicates the impossibility of abandoning the use of coal as one of the main types of fuel and preserving the prospects of Russia as a global supplier of coal.
Coal mining industry of the country, experiencing difficulties associated with ensuring the safety of the work carried out, continues to develop.
Among the positive trends of the largest enterprises in the industry over the past 10 years, there has been an increase in the size of net assets and revenue, an increase in return on investment, and a continuing positive index of industrial production over the past 12 months.
Among the most significant negative trends: a high level of monopolization, instability of profit indicators and an increase in unprofitability, which leads to a decrease in the financial stability of enterprises.
To analyze activity trends in this area the Information agency Credinform using Globas selected the largest companies engaged in the extraction and enrichment of coal and anthracite (TOP 100) in terms of annual revenue for the last reporting periods available in the state statistics bodies and the Federal Tax Service (2015-2020).
Net assets is a ratio that reflects the real value of the company's property that is calculated annually as the difference between the assets on the company's balance sheet and its debt obligations. The net asset ratio is negative (insufficient property) if the company's debt exceeds the value of its property.
The largest company in the industry in terms of net assets is MEZHDURECHYE JSC, INN 4214000252, Kemerovo region - Kuzbass. In 2020, net assets amounted to more than 65 billion RUB.
The smallest size of net assets in the TOP 100 was owned by COAL COMPANY YUZHNAYA JSC, INN 4214021365, Kemerovo region - Kuzbass. The insufficiency of property in 2020 was expressed by a negative value of -69 billion RUB.
During the ten-year period, average industry indicators of net assets values and their growth rates tend to increase (Picture 1).
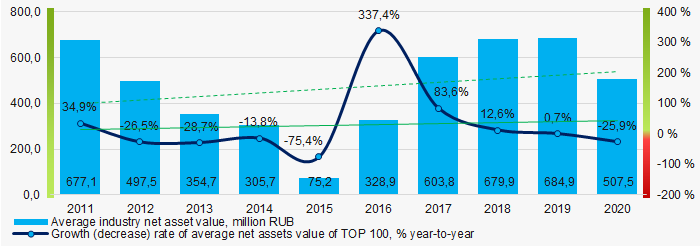 Picture 1. Change in average industry net assets ratios in 2011-2020
The shares of companies with insufficient assets in the TOP 100 have had a positive downward trend for five years. (Picture 2).
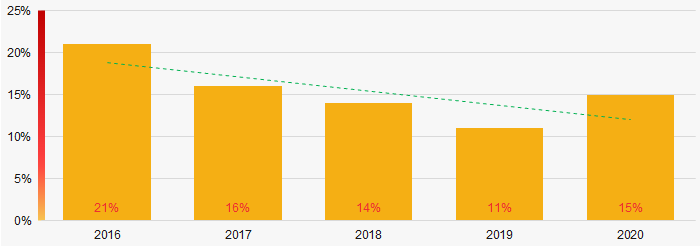 Picture 2. Shares of companies with negative net assets in the TOP 100 in 2016-2020.
Sales revenue
The revenue of the TOP 10 companies in 2020 amounted to 46% of the total revenue of the TOP 100 companies. (Picture 3). This indicates a high level of monopolization in the industry.
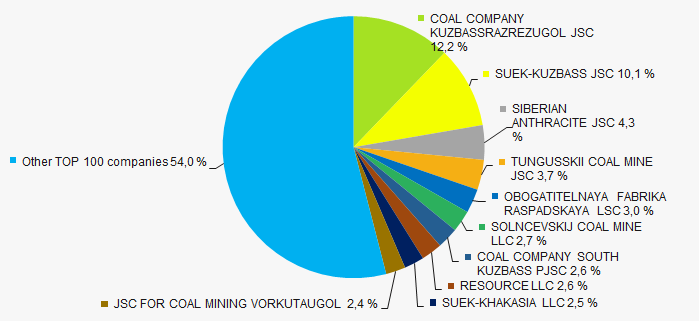 Picture 3. Shares of TOP-10 companies in the total revenue in 2020. TOP-100
For ten years, the average industry indicators of revenue volumes have been increasing, and their growth rates have been decreasing year by year. (Picture 4).
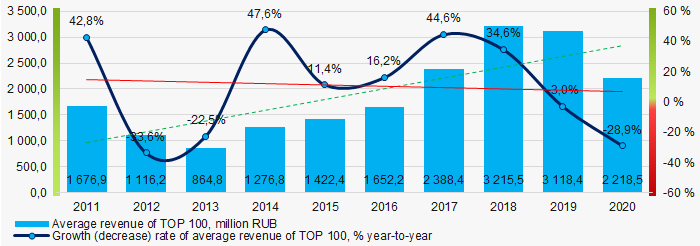 Picture 4. Changes in average industry revenue ratios in 2011-2020
Profit and loss
The largest company in the TOP 100 in terms of net profit in 2020 is JSC HOLDING COMPANY YAKUTUGOL, INN 1434026980, Republic of Sakha (Yakutia). Their profit amounted to almost 38 billion RUB.
During the ten-year period, the indicators of average industry profit margins tend to increase, despite losses over four periods. (Picture 5).
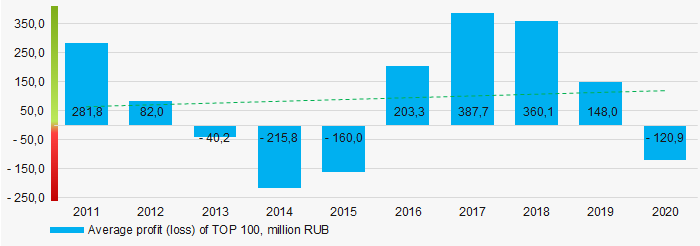 Picture 5. Change in the average industry indicators of profit (loss) in 2012-2020.
During the five-year period, the average industry values of net profit indicators are decreasing, and net loss is increasing (Picture 6).
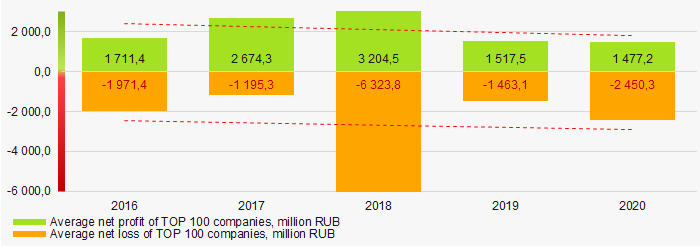 Picture 6. Changes in average values of net profit and net loss indicators of TOP 100 companies in 2016-2020.
Key financial ratios
During the ten-year period, average industry indicators of the total liquidity ratio were mainly below the range of recommended values - from 1.0 to 2.0, with a downward trend. (Picture 7).
Сurrent liquidity ratio (current assets to short-term liabilities) shows sufficiency of a company’s assets to settle short-term liabilities.
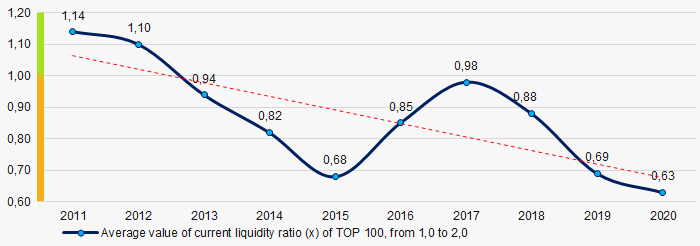 Picture 7. Changes in current liquidity ratio average industry values in 2011-2020
For ten years, the average industry indicators of the return on investment ratio were at a relatively high level and showed an upward trend. (Picture 8).
This ratio is calculated as a ratio of net profit to amount of equity and long-term liabilities and demonstrates return on equity involved in commercial activities and long-term funds raised by organization.
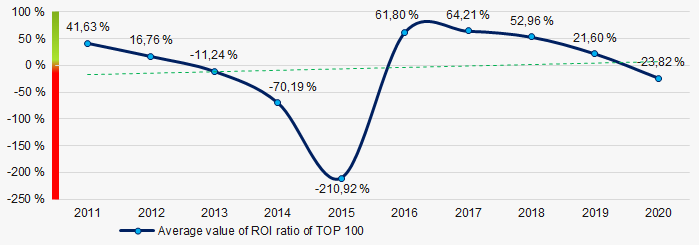 Picture 8. Change in return on investment ratio average values in 2011-2020
Asset turnover ratio is calculated as ratio of sales revenue to average value of total assets for a period and implicates the efficiency of use of all available resources, regardless of the sources they were raised. The ratio shows how many times per year the full cycle of production and turnover is performed generating the corresponding effect in the form of profit.
During the ten-year period, average industry indicators of this business activity ratio tended to decrease (Picture9).
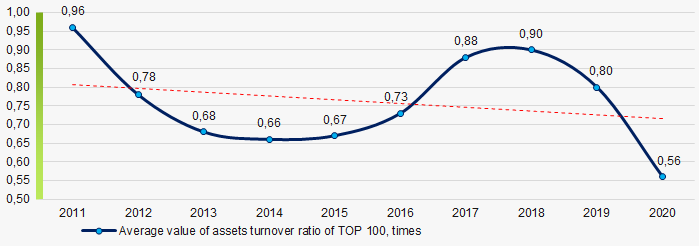 Picture 9. Change in asset turnover ratio average values in 2011-2020
Small enterprises
Only 2% of the TOP 100 companies are registered in the Unified Register of Small and Medium-sized Enterprises of the Federal Tax Service of the Russian Federation. At the same time, the share of their revenue in the total volume of the TOP 100 companies in 2020 is only 0.32%, which is significantly lower than the national average in 2018 - 2019. (Picture 10).
 Picture 10. Revenue share of small and medium-sized enterprises in the TOP 100
Main regions of activity
The TOP 100 companies are registered in 17 regions (20% of the subjects of the Russian Federation) and are distributed unevenly across the country due to the geographical specifics of shipbuilding industry. Almost 64% of the total revenue of TOP 100 companies in 2020 are concentrated in the Kemerovo region - Kuzbass (Picture 11).
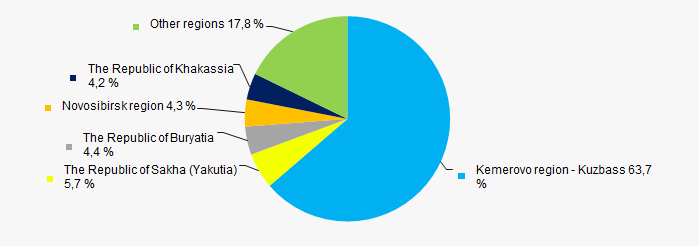 Picture 11. Distribution of TOP 100 companies' revenue by regions of Russia
Financial position score
Assessment of the of TOP 100 companies' financial position shows that the largest part of them is in an average financial position. (Picture 12).
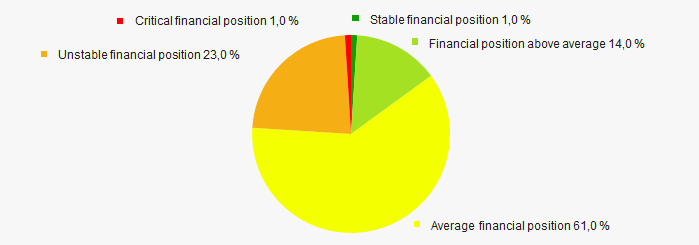 Picture 12. Distribution of TOP 100 companies by financial position score
Globas Solvency Index
The largest part of the TOP 100 companies has been assigned a high Solvency Index by Globas. This indicates their ability to fully meet their debt obligations (Picture 13).
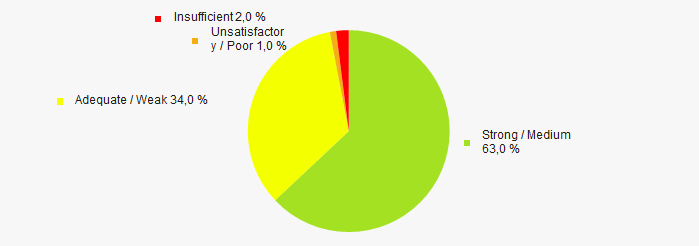 Picture 13. Distribution of TOP 100 companies according to the Globas Solvency Index
 Industrial Production Index
According to the Federal State Statistics Service, during the 12 months of 2020 - 2021, there is an increase in the index of industrial production in coal mining (Picture 14). At the same time, the calculated average index from month to month is 100.9%.
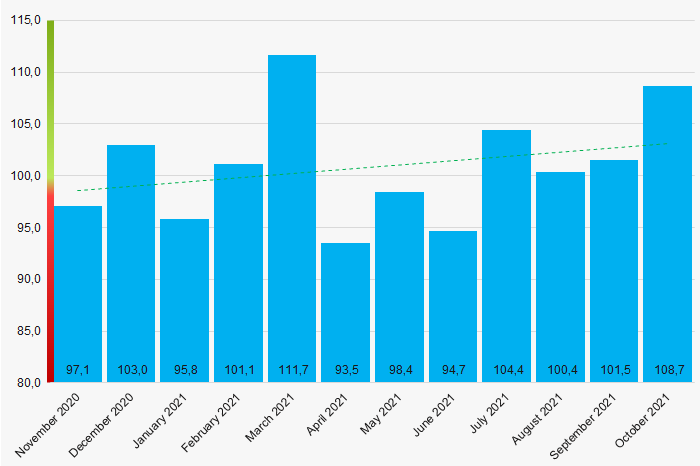 Picture 14. Industrial production index in coal mining in 2020 - 2021, month to month (%)
Conclusion
Comprehensive assessment of the largest coal mining companies indicates the predominance of positive trends in their activities in the period from 2011 to 2020. (Table 1).
| Trends and evaluation factors | Share of factor, % |
| Dynamics of average net assets value | |
| Increase (decrease) rate in the average value of net assets | |
| Increase / decrease in share of enterprises with negative values of net assets | |
| Level of monopolization / competition | |
| Dynamics of average revenue | |
| Growth (decline) rate in average value of revenue | |
| Dynamics of average profit (loss) | |
| Increase / decline in average values of companies' net profit | |
| Increase / decline in average values of companies' net loss | |
| Increase / decrease in average values of overall liquidity ratio | |
| Increase / decrease in average values of return on investment ratio | |
| Increase / decrease in average values of asset turnover ratio, times | |
| Share of small and medium-sized enterprises in revenue is more than 20% | |
| Regional concentration | |
| Financial position (the largest share) | |
| Globas Solvency Index (the largest share) | |
| The average index of industrial production for 12 months is more than 100% | |
| Dynamics of the Industrial Production Index for 12 months. | |
| Average value of factors share | |
![]() positive trend (factor),
positive trend (factor), ![]() negative trend (factor)
negative trend (factor)