
Order a report
Custom-made industry research, company ratings, competitor analysis


Trends in activity of Russian small business
Information agency Credinform has prepared a review of activity trends of Russian small business. The largest companies (ТОP-1000), registered in the Register of small and medium-sized enterprises of the Russian Federal Tax Service, in terms of annual revenue were selected according to the data from the Statistical Register for the latest available periods (2012 - 2017). The analysis was based on data of the Information and Analytical system Globas.
Net assets is a ratio reflecting the real value of company's property. It is calculated annually as the difference between assets on the enterprise balance and its debt obligations. The ratio is considered negative (insufficiency of property), if company’s debt exceeds the value of its property.
| Position in ТОP-1000 Name, INN, activity |
Net assets value, million RUB | Solvency index Globas | ||||
| 2013 | 2014 | 2015 | 2016 | 2017 | ||
| 1 | 2 | 3 | 4 | 5 | 6 | 7 |
| 1 LLC ORIMI TRADE INN 7804069580 Leningrad Region Wholesale of coffee, tea, cocoa and spices |
|
|
|
|
|
196 High |
| 2 NAO Investtrast INN 7751048224 Moscow Predistributive operations of own real estate |
|
|
|
|
|
302 Adequate |
| 3 LLC EDINYI MIGRATSIONNYI TSENTR INN 7842421041 Saint-Petersburg Other human resources provision |
|
|
|
|
|
213 Высокий |
| 4 NAO MURMANSELD 2 INN 5193104130 Murmansk region Marine fishing In process of reorganization in the form of merger of other legal entities, 24.01.2019 |
|
|
|
|
|
178 High |
| 5 SAAMI LTD INN 5193410419 Murmansk region Marine fishing |
|
|
|
|
|
184 High |
| 996 LLC MISHEL - ALKO INN 6125019230 Rostov region Wholesale of alcoholic beverages, including beer and potable ethanol |
|
|
|
|
|
286 Medium |
| 997 LLC TRANSGARANT AGRO INN 2364007084 Krasnodar region Wholesale of grain, unmanufactured tobacco, seeds and animal feeds The bankruptcy case is considered in respect of the company |
|
|
|
|
|
550 Insufficient |
| 998 NAO PHARMAMED INN 7723021855 Moscow Non-specialised wholesale trade |
|
|
|
|
|
237 Medium |
| 999 PAO TYVAENERGOSBYT INN 1701040660 Republic of Tuva Distribution of electricity |
|
|
|
|
|
349 Adequate |
| 1000 PAO MOSOBLFARMATSIYA INN 5074114509 Moscow region Retail sale of pharmaceuticals in specialised stores (drugstores) |
|
|
|
|
|
321 Adequate |
![]() — growth indicator in comparison with prior period,
— growth indicator in comparison with prior period, ![]() — decline indicator in comparison with prior period.
— decline indicator in comparison with prior period.
For the last five years, the average values of TOP-1000 net assets showed the growing tendency (Picture 1).
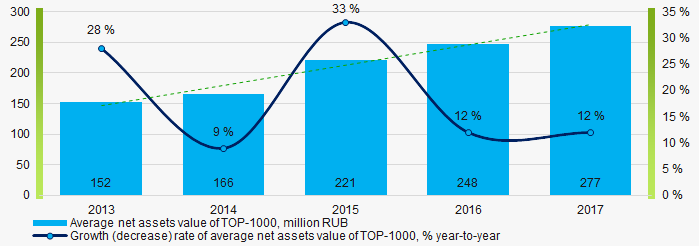 Picture 1. Change in average net assets value of ТОP-1000 companies in 2013 – 2017
 For the last five years, the share of ТОP-1000 enterprises with lack of property showed the downward trend (Picture 2).
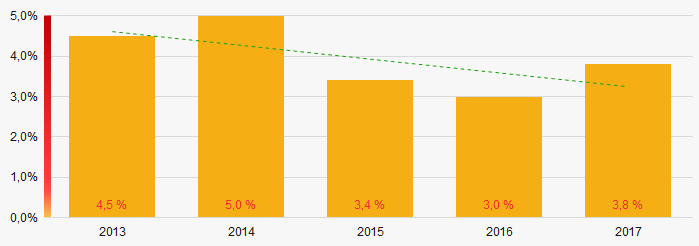 Picture 2. The share of enterprises with negative net assets value in ТОP-1000
Sales revenue
In 2017, the total revenue of 10 largest companies amounted to 10% from ТОP-1000 total revenue (Picture 3). This fact testifies high level of competition within small businesses.
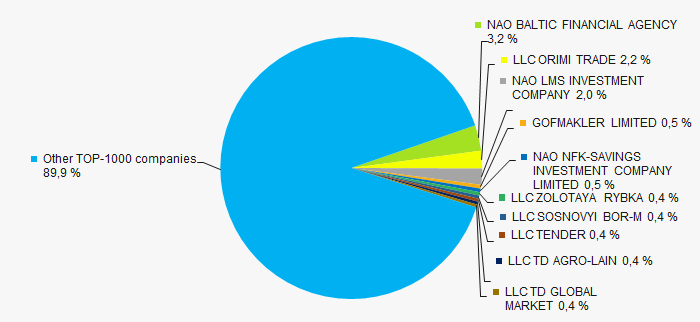 Picture 3. Shares of TOP-10 in TOP-1000 total revenue for 2017
In general, the increasing tendency in revenue is observed (Picture 4).
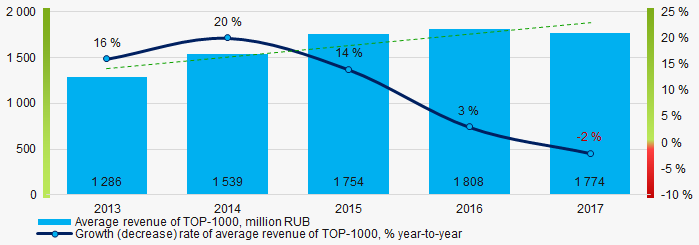 Picture 4. Change in average revenue of TOP-1000 in 2013 – 2017
Profit and loss
In 2017 profit of 10 largest companies amounted to 25% from TOP-1000 total profit (Picture 5).
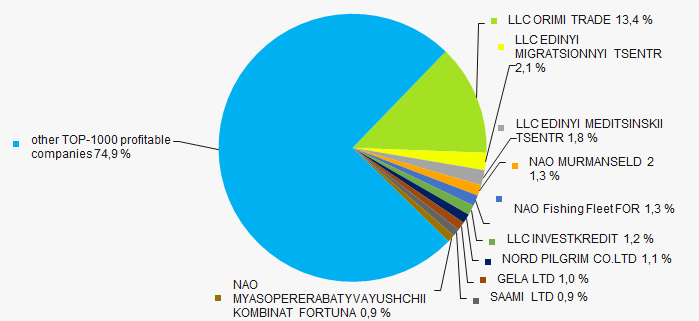 Picture 5. Shares of TOP-10 companies in TOP-1000 total profit for 2017
For the last five years, the average profit values of TOP-1000 show the increasing tendency (Picture 6).
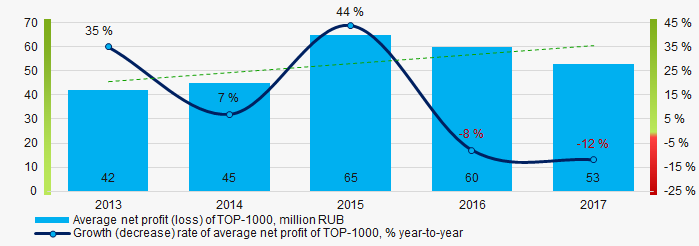 Picture 6. Change in average profit of TOP-1000 in 2013 – 2017
Over a five-year period, the average net profit values of ТОP-1000 show the increasing tendency, along with this the average net loss is growing (Picture 7).
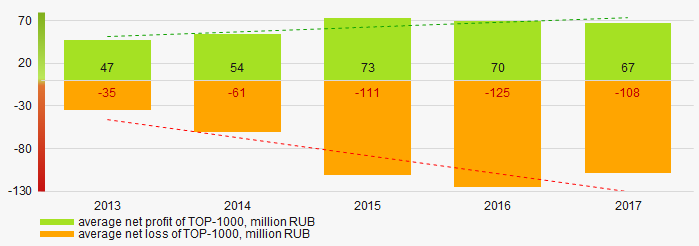 Picture 7. Change in average net profit/loss of ТОP-1000 companies in 2013 – 2017
 Main financial ratios
For the last five years, the average values of the current liquidity ratio were higher than the recommended values - from 1,0 to 2,0, with growing tendency (Picture 8).
The current liquidity ratio (ratio of total working capital to short-term liabilities) shows the sufficiency of company’s assets to meet short-term obligations.
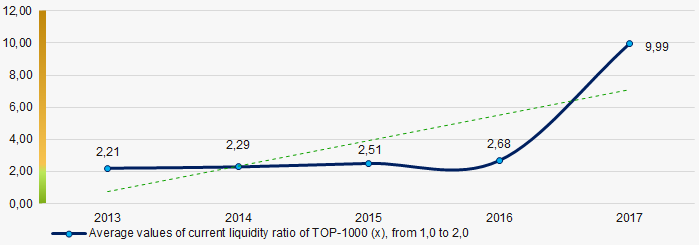 Picture 8. Change in average values of current liquidity ratio of TOP-1000 companies in 2013 – 2017
For the last five years, the high level of the average values of ROI ratio with increasing tendency is observed (Picture 9).
The ROI ratio is calculated as a ratio of net profit to sum of stockholder equity and long-term liabilities and shows the return from equity involved in commercial activities and long-term borrowed funds.
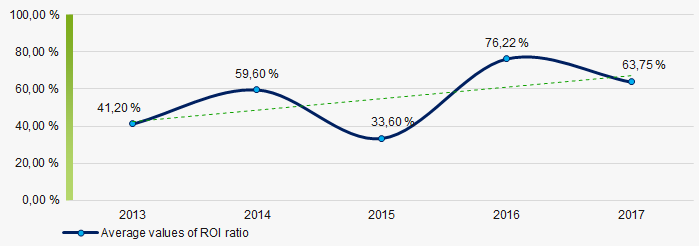 Picture 9. Change in average values of ROI ratio in 2013 – 2017
Assets turnover ratio is the ratio of sales revenue and company’s average total assets for a period. It characterizes the effectiveness of using of all available resources, regardless the source of their attraction. The ratio shows how many times per year the full cycle of production and circulation is performed, generating the corresponding effect in the form of profit.
For the last five years, this business activity ratio demonstrated the downward trend (Picture 10).
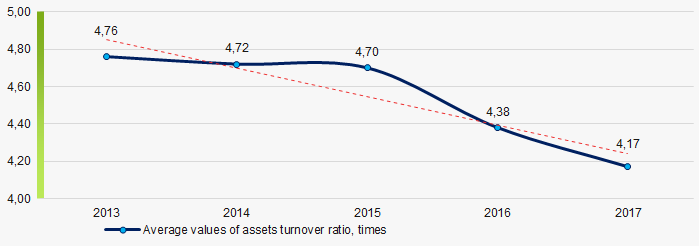 Picture 10. Change in average values of assets turnover ratio of TOP-1000 companies in 2013 – 2017
Production structure
The largest share of ТОP-1000 total revenue is occupied by the enterprises engaged in wholesale trade (Picture 11).
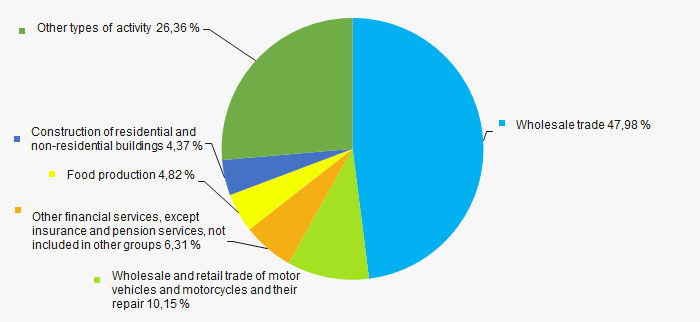 Picture 11. Distribution of activities in ТОP-1000 total revenue
Among small businesses in ТОP-1000 list, the largest share in total revenue have medium-sized enterprises (Picture 12).
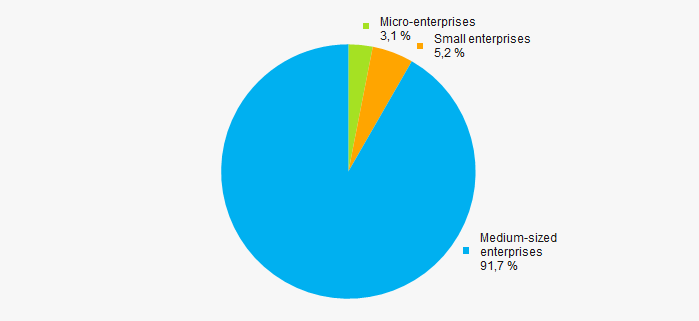 Picture 12. Shares of small and medium-sized enterprises in ТОP-1000, %
Main regions of activity
ТОP-1000 companies are unequally located across the country. 35% of the largest enterprises in terms of revenue are located in Moscow and St. Petersburg (Picture 13).
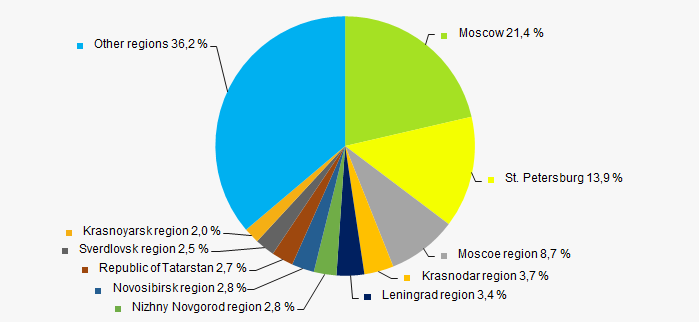 Picture 13. Distribution of TOP-1000 revenue by 10 most populated regions of Russia
Financial position score
An assessment of the financial position of TOP-1000 companies shows that more than a half of them have stable or above average financial position (Picture 14).
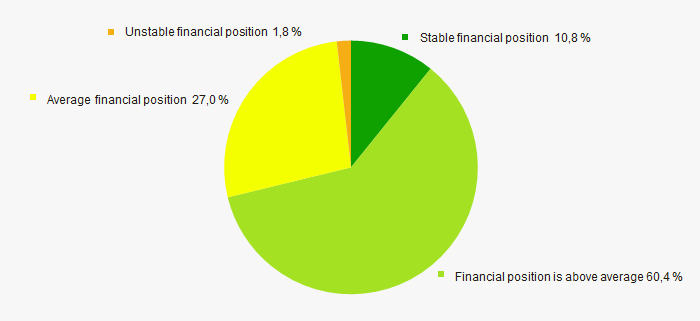 Picture 14. Distribution of TOP-1000 companies by financial position score
Solvency index Globas
Most of TOP-1000 companies got superior/high or strong/medium Solvency index Globas, this fact shows the ability of the companies to meet their obligations in time and fully (Picture 15).
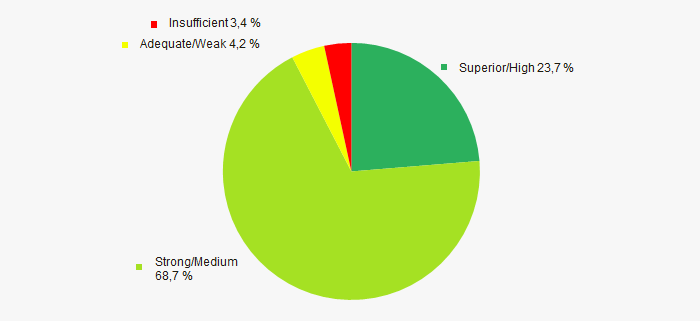 Picture 15. Distribution of TOP-1000 companies by Solvency index Globas
Conclusion
A complex assessment of activity of the largest companies of Russian small business, taking into account the main indexes, financial ratios and indicators, demonstrates the presence of positive trends (Table 2).
| Trends and assessment factors | Relative share, % |
| Growth/drawdown rate of average net assets value | |
| Increase / decrease in the share of enterprises with negative net assets | |
| The level of capital concentration | |
| Growth/drawdown rate of average revenue | |
| Growth/drawdown rate of average net profit (loss) | |
| Increase / decrease in average net profit of companies | |
| Increase / decrease in average net loss of companies | |
| Increase / decrease in average values of current liquidity ratio | |
| Increase / decrease in average values of ROI ratio | |
| Increase / decrease in average values of assets turnover ratio, times | |
| Regional concentration | |
| Financial position (the largest share) | |
| Solvency index Globas (the largest share) | |
| Average value of factors | |
![]() — favorable trend (factor),
— favorable trend (factor), ![]() — unfavorable trend (factor).
— unfavorable trend (factor).