
Order a report
Custom-made industry research, company ratings, competitor analysis


Return on sales of household electric appliances
Information agency Credinform represents the ranking of the largest Russian wholesalers of household electric appliances. Trading companies with the largest volume of annual revenue (TOP-10) were selected for the ranking, according to the data from the Statistical Register for the latest available periods (for 2016 - 2018). Then they were ranked by the return on sales ratio (Table 1). The analysis was made on the basis of the data of the Information and Analytical system Globas.
Return on sales (%) is calculated as the share of operating profit in the total sales of a company. The ratio reflects the efficiency of industrial and commercial activity of an enterprise and shows the share of company’s funds obtained as a result of sale of products, after covering its cost of sales, paying taxes and interest payments on loans.
The spread in values of the return on sales in companies of the same industry is determined by differences in competitive strategies and product lines.
The experts of the Information agency Credinform, taking into account the actual situation both in the economy as a whole and in the sectors, has developed and implemented in the Information and Analytical system Globas the calculation of practical values of financial ratios that can be recognized as normal for a particular industry. For wholesalers of household electric appliances the practical value of the return on sales ratio made from 3,96% in 2018.
For getting of the most comprehensive and fair picture of the financial standing of an enterprise it is necessary to pay attention to all combination of indicators and financial ratios.
| Name, INN, region | Revenue, million RUB | Net profit (loss), million RUB | Return on sales, % | Solvency index Globas | |||
| 2017 | 2018 | 2017 | 2018 | 2017 | 2018 | ||
| 1 | 2 | 3 | 4 | 5 | 6 | 7 | 8 |
| RBT COMPANY LLC INN 7452030451 Moscow |
|
|
|
|
|
|
180 High |
| WHIRLPOOL RUS LLC INN 7717654289 Moscow |
|
|
|
|
|
|
240 Strong |
| ALMA LLC INN 7701713130 Moscow, case on declaring the company bankrupt (insolvent) is proceeding bankruptcy proceedings since 20.11.2019 |
|
|
|
|
|
|
550 Insufficient |
| HASKEL LLC INN 7719269331 Moscow region |
|
|
|
|
|
|
187 High |
| SONY ELECTRONICS NJSC INN 7703001265 Moscow |
|
|
|
|
|
|
225 Strong |
| DISRTIBUTION CENTRE LLC INN 5047067909 Moscow region |
|
|
|
|
|
|
204 Strong |
| MONT LLC INN 7703313144 Moscow |
|
|
|
|
|
|
174 Superior |
| ELEKTROSISTEM LLC INN 7704844420 Moscow, In process of reorganization in the form of acquisition of other legal entities, 11.11.2019 |
|
|
|
|
|
|
249 Strong |
| TRADE HOUSE ABSOLUT LLC INN 7726600963 Moscow |
|
|
|
|
|
|
307 Adequate |
| TFN LLC INN 7727696432 Moscow |
|
|
|
|
|
|
225 Strong |
| Avearge value by TOP-10 companies | |
|
|
|
|
|
|
| Industry average value | |
|
|
|
|
|
|
![]() improvement of the indicator to the previous period,
improvement of the indicator to the previous period, ![]() decline in the indicator to the previous period.
decline in the indicator to the previous period.
The average value of the return on sales of TOP-10 enterprises is below industry average and practical values. Nine companies improved results in 2018.
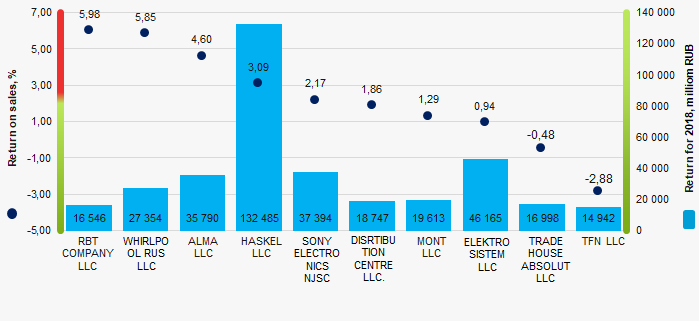 Picture 1. Return on sales ratio and revenue of the largest Russian wholesalers of household electric appliances (TOP-10)
The industry average indicators of the return on sales trend to increase over the course of 10 years (Picture 2).
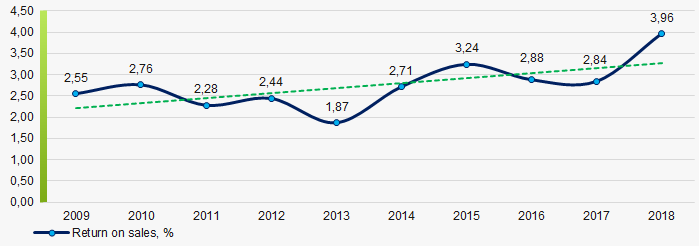 Picture 2. Change in the industry average values of the return on sales ratio of Russian wholesalers of household electric appliances in 2009 – 2018