Ranking
Profitability of services of the Russian debt collection agencies

Information agency Credinform prepared a ranking of profitability of services of the Russian debt collection agencies.

The Russian debt collection agencies (Top-10) with the highest volume of revenue were selected for this ranking according to the data from the Statistical Register for the latest available periods (2015 and 2014). The enterprises were ranked by decrease in profitability of services (see table 1).

Profitability of services or goods is sales profit to expenses from ordinary activities. Profitability in general indicates production efficiency. The analyses of profitability of services allows to conclude about expediency of one or another kind of services. There is no standard value for profitability indicators, because they change in accordance with the industry the company operates in.

For the most complete and objective view of the financial condition of the enterprise it is necessary to pay attention to the complex of presented ratios, financial and other indicators of the company.

Table 1. Net profit, revenue, profitability of services and solvency index Globas-I of the Russian debt collection agencies (Top10)
NameNet profit 2015, bln RUBReveue 2015, bln RUBReveue 2015 to 2014, +/- %Profitability of services, %Solvency index Globas-i
LLC ZHILKOMINKASSO-NIZHNIY NOVGOROD
INN 5257119624 Nizhniy Novgorod region
15,32 64,75 78,4 55,36 191
The highest
LLC FIRST RUSSIAN RECOVERY
INN 5402573988 Novosibirsk region
-5,47 33,86 -12,3 49,45 403
Satisfactory
LLC IRKUTSKENERGO-AKTIV
INN 3811095792 Irkutsk region
2,59 9,11 201,6 24,47 189
The highest
LLC NATIONAL AGENCY ON DEBT COLLECTION
INN 7728718713 Moscow
12,47 33,49 2,6 21,34 262
High
LLC ARGUMENT
INN 0276114446 Republic of Bashkortostan
3,48 66,16 316,6 16,01 175
The highest
LLC CREDITEXPRESS FINANCE
INN 7707790885 Moscow
4,30 916,88 11,3 7,94 244
High
LLC NOVATOR-SERVIS
INN 6829029316 Tambov region
0,23 7,84 44,1 7,04 213
High
LLC CENTER FOR SETTLEMENT OF DEBT
INN 0264067752 Republic of Bashkortostan
-0,19 6,48 59,6 2,63 331
Satisfactory
LLC NATIONAL DEBT AGENCY
INN 3255516816 Bryansk region
0,69 168,08 -8,9 0,53 308
Satisfactory
LLC UNIFIED CASH PROCESSING CENTER OF NIZHNIY NOVGOROD REGION
INN 5249089687 Nizhniy Novgorod region
-9,12 65,95 -9,9 -14,81 298
High

Average value of profitability of services for the Top-10 companies amounted to 17,0% in 2015. Average value in Top-25 amounted to 32,2% at industry average value of 6,7%.

Seven companies in the Top got high solvency index Globas-i indicating their ability to timely and fully fulfill their debt liabilities.

Three companies got satisfactory index. LLC FIRST RUSSIAN RECOVERY has active writs of execution and loss in key figures; there are also cases of delays in payments. LLC CENTER FOR SETTLEMENT OF DEBT has loss in key figures. LLC NATIONAL DEBT AGENCY has insufficient amount of working assets for funding debt.

Profitability of services and revenue of the Russian debt collection agencies (TOP-10)
Picture 1. Profitability of services and revenue of the Russian debt collection agencies (TOP-10)

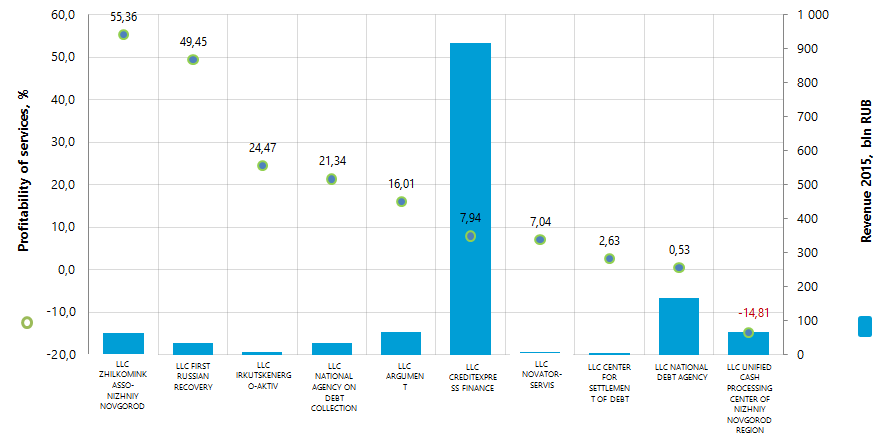
Total revenue of the TOP-10 in 2015 amounted to 1,4 bln RUB that is by 13% higher than in 2014. At the same time total net profit of the same group decreased in 7,6 times.

Five companies in the Top (marked with red in Table 1) have decrease in net profit or loss in comparison with the previous period, or decrease in revenue.

Total revenue of TOP-25 companies for the same period increased by almost 14% at increase in total net profit by 66%.

In general, the Russian market of debt collection services is not fully-formed yet. The Federal law regulating debt collection is coming into force since January 1, 2017.

In case of orderly formation of these services’ market within the frameworks of the law, debt collection agencies will have quite good development prospects considering the potential volume of debt collection services. This is shown by estimated data on debts growth rates (Picture 2) based on information of the Federal state statistics service and the Central Bank of Russia on nominal debts values (Table 2).

Table 2. Nominal debt values, mln RUB
 2010201120122013201420159 months of 2016
Trade payables for goods, works and services 8 791 247 10 667 130 12 510 870 14 947 143 16 744 745 18 044 549 18 126 867
Accounts receivable of organizations providing housing services 579 380 649 154 773 561 875 444 952 440 1 064 746 1 081 464
Outstanding loans granted by credit institutions to resident individuals 3 715 266 5 218 029 7 474 220 9 698 950 11 005 289 10 366 829 10 538 916
Debt on housing loans granted by credit institutions to resident individuals in rubles 1 050 901 1 356 057 1 860 892 2 476 273 3 360 775 3 782 381 4 329 775
Debt on loans granted to small and medium-sized businesses and individual entrepreneurs as of 1 October 3 455 844 4 130 651 4 925 291 5 755 001 5 784 212 5 385 111 4 926 069

For the whole six years from 2010 to 2015, the significant growth of debts in nominal values is observed from 1,6 to 3,6 times in dependence of the industry. At the same time growth rates of debts has significantly decreased in the last two years (Picture 2, decrease in nominal value is marked with green in Table 2).

Rates of growth (decrease) of debts by categories from year to year, %
Picture 2. Rates of growth (decrease) of debts by categories from year to year, %

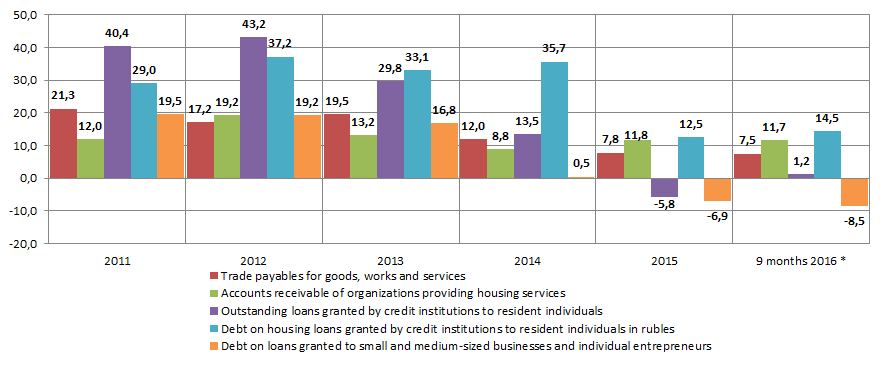
*) – Data for 9 months of 2016 is presented to the relevant period of 2015.

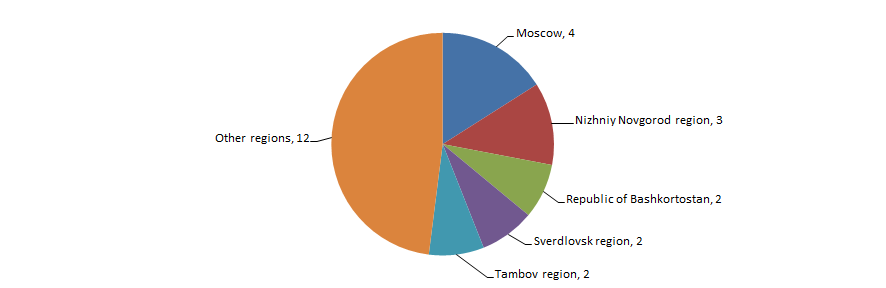
There is no strongly marked concentration of debt collection agencies in the regions of Russia. According to the Information and analytical system Globas-i 25 of companies in the sector with the highest volume of revenue for 2015 are located in 17 regions of Russia (Picture 3).

Regional distribution of 25 debt collection agencies of Russia
Picture 3. Regional distribution of 25 debt collection agencies of Russia
Herald
Russian business: development trends and leaders

The year of 2016, unclear for the Russian economy, has gone: following the results for 11 months of 2016, at negative GDP dynamics and consumer market fall, the industry demonstrated growth by 0,8% compared to the same period in 2015; stabilization of real income of the population is also observed.

Trends by key indicators of the largest companies’ activity form multidirectional. The Russian business is quite diversified and not concentrated on oil extraction alone. Thesis of “raw-exports role” is disproved with analyses of real economy enterprises’ financial accounts: hi-tech production demonstrates not only significant turnover volumes, but also huge numbers of its growth.

According to the last available accounting reports of companies with revenue over 10 bln RUB for Q3 2016, Russian Нelicopters JSC having increased revenue in more than 11 times in comparison with the relevant period of 2015 and became a turnover growth leader. Manufacture of heavy helicopters is a complex and science-driven process which can be supported by only the largest and economically powerful states.

PJSC Mechel is ranked the second: it appears the corporation has overcome all financial difficulties and demonstrated impressive results: the group’s turnover in Q3 2016 amounted to 11 263 mln RUB opposite to 2 028 mln RUB in Q3 2015.

PJSC Rosseti, key energy networks operator and one of the leading power grid company in the world, closes top three: turnover for Q3 2016 has increased by 382% (see Table 1).

Table 1. Leaders by increase in quarter1
Company Revenue for Q3 2015, mln RUB Revenue for Q3 2016, mln RUB Increase in revenue Business scope2
1 Russian helicopters JSC 3 037 33 852 1015% 11,1 times Russian Helicopters is a leading player in the global helicopter industry, the sole Russian rotorcraft designer and manufacturer. According to the holding’s data, in 2015 there were over 8,400 Russian helicopters operating in over 100 countries. Russian Helicopters products account for approximately 94% of the rotorcraft market in Russia and 10% of worldwide helicopter sales.
2 PJSC MECHEL 2 028 11 263 456%
5,6 times
One of the leading companies in mining and metal industry and producer of coal, iron ore, steel, rolled products, ferroalloys, heat and electric power.
3 PJSC ROSSETI 5 358 25 829 382%
4,8 times
The company is the largest strategic electric grid in Russia and one of the world leaders in the transportation and distribution of electricity. The company manages 2.30 mln km of transmission lines, 490 th substations with transformer capacity of more than 761 GWA. In 2015 net electricity supply to consumers amounted to 720,5 bln kW/h.
4 PJSC NPO Almaz 10 168 32 803 223%
3,2 times
The company develops antiaircraft guided missile system, air defense, missile and aerospace defense system.
5 PJSC PhosAgro 12 178 31 549 159%
2,6 times
One of the world's leading producers of phosphate fertilizers and feed phosphates, nitrogen fertilizers and ammonia.
6 JSC TYAZHMASH 4 895 12 339 152%
2,5 times
The company develops crushing and grinding, fuel preparing, conveying equipment, equipment for nuclear power plants and terrestrial cosmodrome's launch complex.
7 JSC V.A.Degtyarev Plant 8 689 20 063 131%
2,3 times
The company produces military products: aircraft gun armament, anti-tank, anti-aircraft missile weapons, as well as a certain range of civil products.
8 JSC Sukhoi Civil Aircraft Company 12 392 27 829 125%
2,2 times
Currently the company's main project is the program to create the Sukhoi Superjet 100 aircraft.
9 PJSC TMK 49 872 106 064 113%
2,1 times
The company produces a wide range of tubular products for companies of various industries, especially oil and gas.
10 JSC Scientific Production Corporation Uralvagonzavod 31 563 61 479 95%
1,9 times
ПроThe company produces weapons and military equipment, railway rolling stock and light railway, road construction and utility vehicles.

(1) Information in tables 1 and 2 is presented in accordance with selection of real economy companies with quarter revenue for the examined period over 10 bln RUB, provided accounting reports for Q3 2016.
(2) Business scope in tables 1 and 2 is given according to the companies’ own data.

Along with the leaders, every business has companies with negative dynamics of figures. Negative external environment on products and commodity markets, movement of national currency, unstable domestic demand and lack of investment lead to decline in turnover. It should be noted that decrease in percentage is lower than growth. Among companies with turnover exceeding 10 bln RUB the following companies stand apart: JSC RUSAL BRATSK ALUMINIUM SMELTER with -72%, PJSC Kazan helicopter plant and PJSC Irkut Corporation have -50% and -45% relatively (see Table 2).

Table 2. Companies with negative dynamics in quarter revenue
Company Revenue for Q3 2015,
mln RUB
Revenue for Q3 2016,
mln RUB
Decrease in revenue Business scope
1 JSC RUSAL BRATSK ALUMINIUM SMELTER 58 042 16 224 72% The largest aluminum producer in the world.
2 PJSC Kazan helicopter plant 36 178 18 134 50% Manufacture of Mi-8/17, "Ansat" helicopters and make preparations for production of new Mi-38.
3 PJSC Irkut Corporation 38 143 20 954 45% The company designs and manufactures aircraft equipment for military and civil purposes.
4 PJSC United Aircraft Corporation 20 922 12 878 38% One of the largest players in the global aviation market. Companies included in Corporation have the rights to such famous brands as "Su", "MiG", "IL", "Tu", "Yak", "Beriev" as well as new - SSJ, the MS-21.
5 Oil company LUKOIL PJSC 249 294 180 935 27% One of the largest vertically integrated oil and gas companies in the world, which accounts for 2% of global oil production and about 1% of proven hydrocarbons reserves. The company controls the entire production chain from oil and gas to oil products. 88% stocks and 83% hydrocarbon production accounts for the RF.
6 PJSC Uralkali 129 974 99 667 23% Leading vertically integrated global manufacturer of potassium, one of the most important elements for development of all living organisms. The company accounts for about 20% of the world production of potash fertilizers. The company controls the entire production chain from potash ore mining to supply of potash chloride to customers.
7 PJSC Mashinostroitelny Zavod 14 192 11 164 21% One of the world's leading manufacturers and suppliers of nuclear fuel for nuclear power plants. The company also produces fuel for research reactors and reactor facilities of the navy ships.
8 PJSC Southern Kuzbass 24 572 19 485 21% Produces concentrate of coking and steam coal, anthracite, coal for PCI and middling product - supplied in the enriched form and graded (97% of total production) on the domestic market and for export.
9 PJSC Tolyattiazot 46 132 36 739 20% One of the largest enterprises of chemical industry of Russia, one of the three major producers of ammonia in the country and the world's top ten. The world's only chemical plant, capable to produce 3 million tons of ammonia per year.
10 PJSOC Bashneft 399 561 340 510 15% The company is engaged in exploration and production of oil and gas, production of petroleum products and petrochemicals. At the end of 2015 the company was ranked sixth in terms of oil production and fourth in terms of primary processing volume among Russian oil companies.

Despite of structural problems of the economy, business environment in Russia develops positively. Gross revenue of real economy companies (taking into account the price deflator) grows together with balanced net profit: according to the Federal State Statistics Service data for January-September 2016, the share of companies with net profit over 71% in the country. Positive quarter GDP values and revival of demand on products of the Russian manufacturers are expected in 2017, and the new year could be dealt with optimism.