
Order a report
Custom-made industry research, company ratings, competitor analysis

Trends in activity of the largest companies of Saint-Petersburg's real economy
Information Agency Credinform has prepared the review of trends in activity of the largest companies of Saint-Petersburg's real economy.
The largest enterprises (TOP-10 and TOP-1000) in terms of annual revenue were selected according to the data from the Statistical Register for the latest available periods (2015 and 2016). The analysis was based on data of the Information and Analytical Globas.
Sales revenue
In 2016 total revenue of 10 largest companies amounted to 40% from TOP-1000 total revenue. In 2016, the largest company by total revenue is PAO GAZPROM NEFT – vertically integrated oil company, engaged in oil and gas fields exploration and development, oil refining, production and sale of petroleum products (Picture 1).
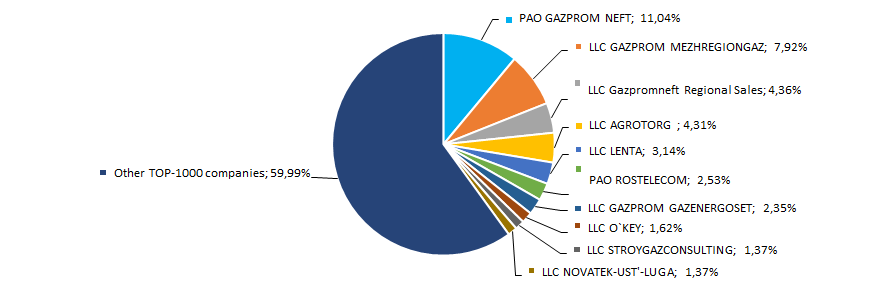 Picture 1. Shares of TOP-10 companies in TOP-1000 total revenue for 2016
For the three-year period, the best results by revenue in TOP-1000 were achieved in 2016. In general, the increase in sales revenue is observed (Picture 2).
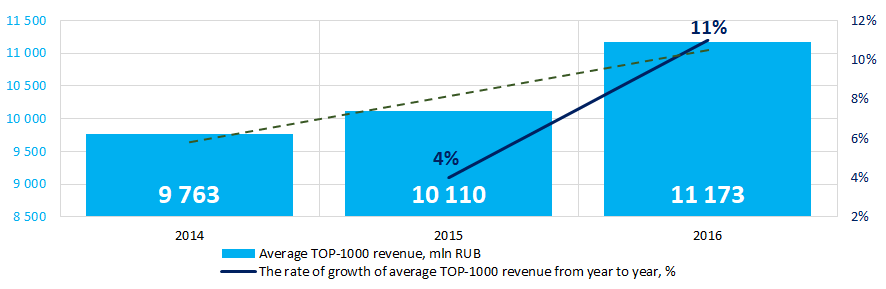 Picture 2. Change in average revenue of the largest companies of Saint-Petersburg's real economy in 2014 – 2016
Profit and loss
In 2016, profit of 10 largest companies amounted to 52% from TOP-1000 total profit. In 2016, the leading positions by profit take LLC RN-TRADE – the subsidiary of PAO ROSNEFT OIL COMPANY, engaged in retail sale of motor fuels through the filling station chain and to small wholesale consumers, and PAO GAZPROM NEFT (Picture 3).
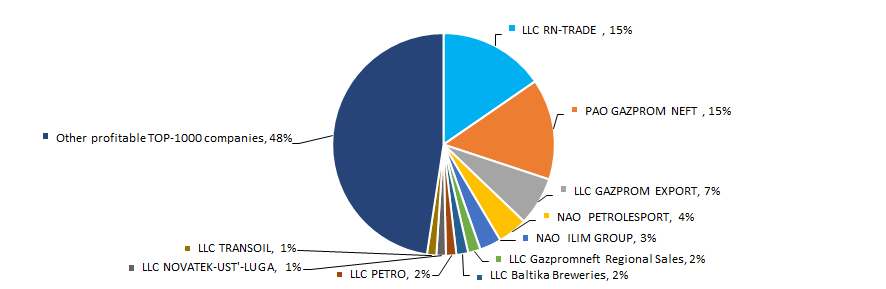 Picture 3. Shares of TOP-10 companies in TOP-1000 total profit for 2016
For the three-year period, the average revenue values of TOP-1000 companies show the growing tendency (Picture 4).
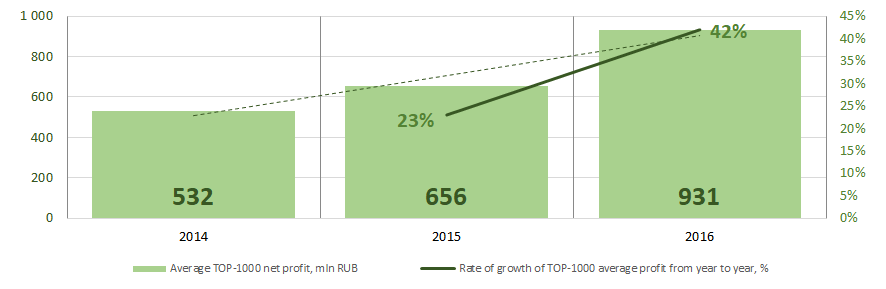 Рисунок 4. Picture 4. Change in average profit of the largest companies of Saint-Petersburg's real economy in 2014 – 2016
Main financial indicators
For 2014 – 2016 period the average values of current liquidity ratio of TOP-1000 were higher or within the recommended values – from 1,0 to 2,0 (Picture 5).
Current liquidity ratio (ratio of total working capital to short-term liabilities) shows the sufficiency of company’s assets to meet short-term obligations.
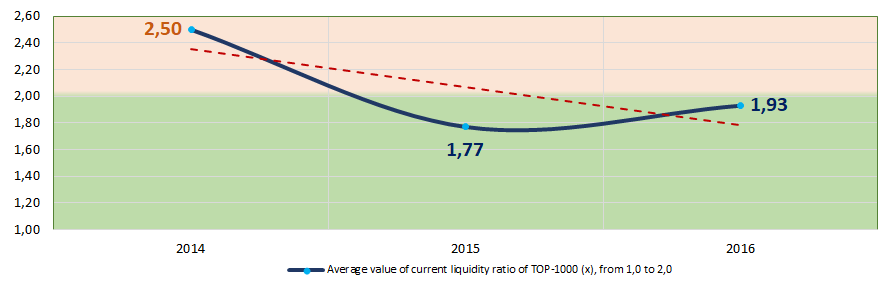 Picture 5. Change in average values of current liquidity ratio of the largest companies of Saint-Petersburg's real economy in 2014 – 2016
For the three-year period, the instability of ROI ratio with increasing tendency was observed (Picture 6). The ROI ratio is calculated as a ratio of net profit to sum of stockholder equity and long-term liabilities and shows the return from equity involved in commercial activities and long-term borrowed funds.
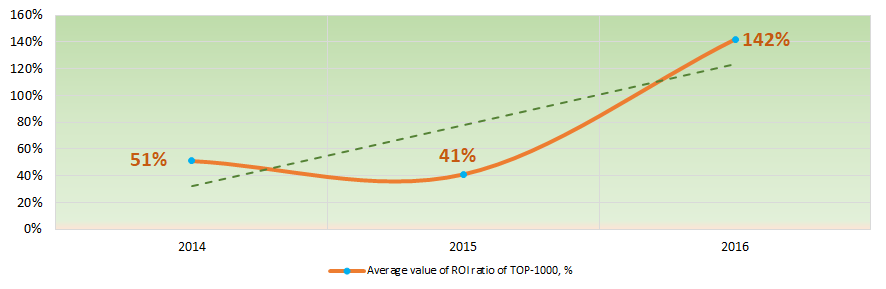 Picture 6. Change in average values of ROI ratio of the largest companies of Saint-Petersburg's real economy in 2014 – 2016
Assets turnover ratio is the ratio of sales revenue and company’s average total assets for a period. It characterizes the effectiveness of using of all available resources, regardless the source of their attraction. The ratio shows how many times per year the full cycle of production and circulation is performed, generating the corresponding effect in the form of profit.
For the three-year period, this business activity ratio in general demonstrated the upward trend (Picture 7).
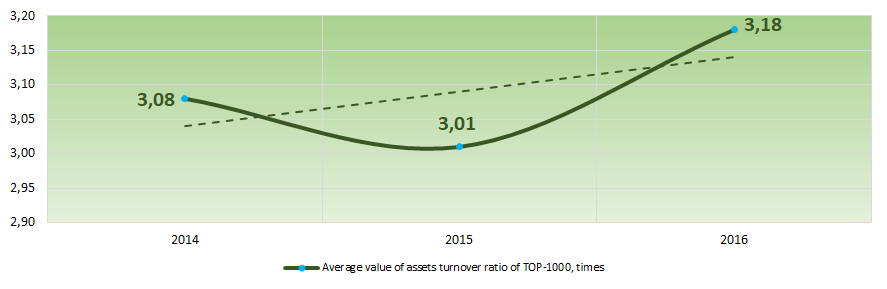 Picture 7. Change in average values of business activity ratio of the largest companies of Saint-Petersburg's real economy in 2014 – 2016
Production and services structure
The largest share in TOP-1000 total revenue take companies engaged in wholesale trade and production of motor vehicles (Picture 8).
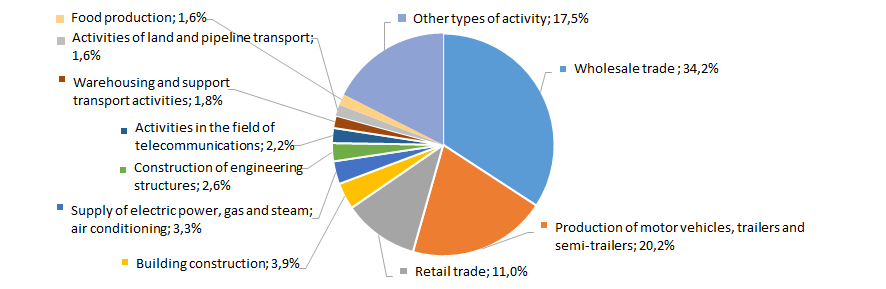 Picture 8. Distribution of activities in TOP-1000 total revenue, %
Main regions of initial registration
The majority of companies with initial registration outside Saint-Petersburg was founded in Leningrad region (Picture 9).
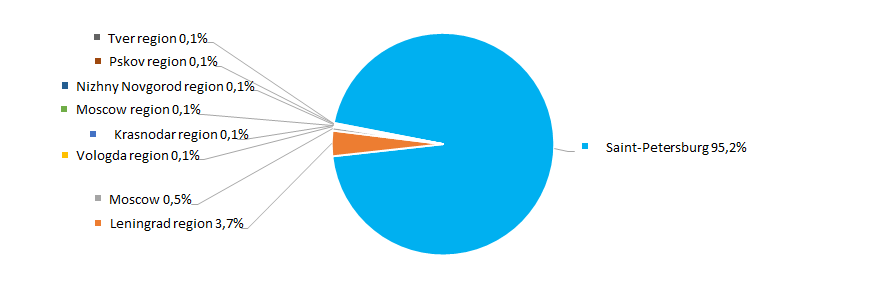 Picture 9. Distribution of TOP-1000 companies by initial registration regions
Financial position score
The assessment of company’s financial position shows that more than a half of companies have above average financial position (Picture 10).
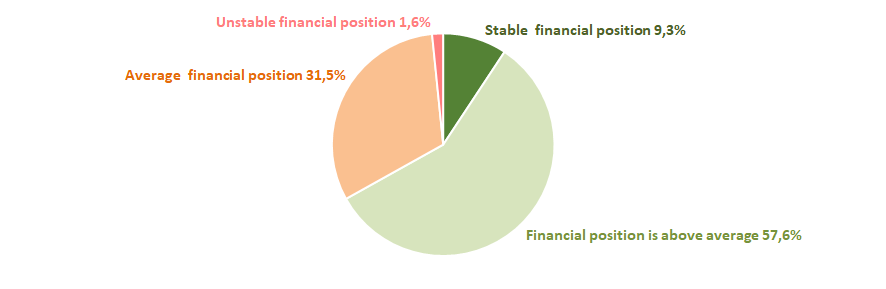 Picture 10. Distribution of TOP-1000 companies by financial position score
Liquidity index
44% of TOP-1000 companies demonstrate rather low level of bankruptcy risk in the short-term period and more than one third have average level of bankruptcy risk (Picture 11).
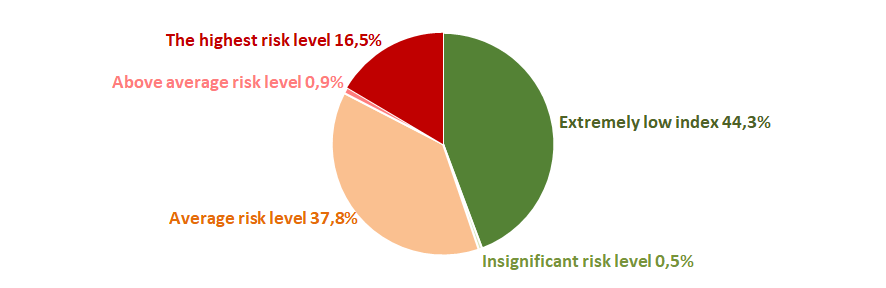 Picture 11. Distribution of TOP-1000 companies by liquidity index
Solvency index Globas
The majority of TOP-1000 companies have superior/high or strong/medium solvency index Globas, this fact shows the ability of the companies to meet their obligations in time and fully (Picture 12).
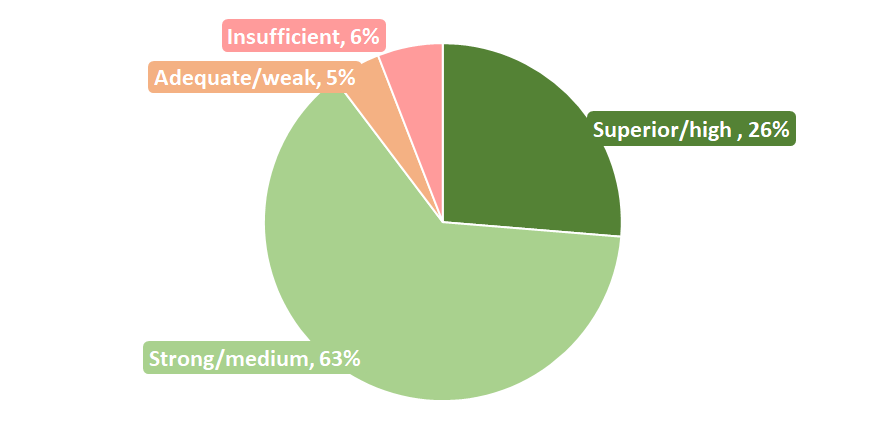 Picture 12. Distribution of TOP-1000 companies by solvency index Globas
Hereby, the complex assessment of the largest companies of Saint-Petersburg's real economy, taking into account main indexes, financial ratios and indicators, demonstrates the denomination of favorable trends.