Order a report
Custom-made industry research, company ratings, competitor analysis


Current liquidity ratio of the largest toys manufacturers
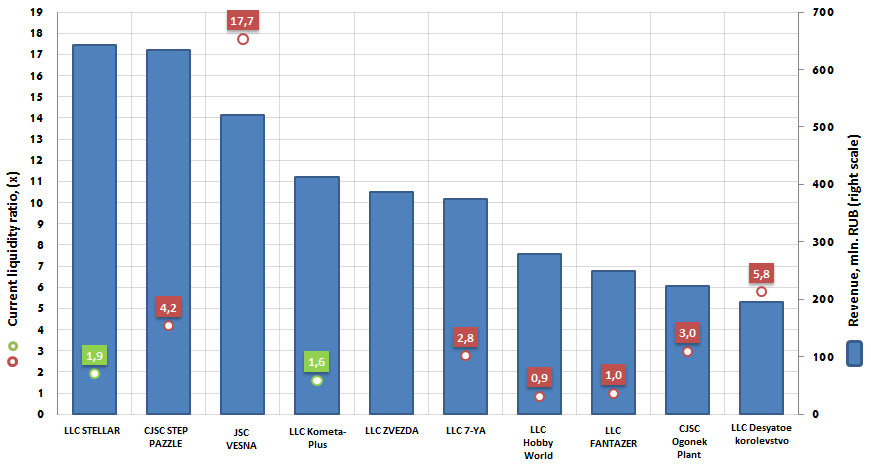
Information Agency Credinform has prepared the ranking of the largest Russian toys manufacturers.
Top-10 enterprises, ranged by decrease in revenue, were selected according to the data from the Statistical Register for the latest available period (for the year 2014); the liquidity ratio was calculated for each company (if data are available).
The current liquidity ratio (х) is a ratio of total working capital and short-term liabilities. It shows the sufficiency of funds to repay the obligations, execution date of which comes earlier than 12 months.
The recommended value: from 1,5 to 2,5. It should be understood, that actual data may significantly vary from the presented normative range for enterprises of different and same industries.
There are highly liquid, low liquid and illiquid values (assets). The easier and faster you can exchange the asset, taking into account its full cost, the more liquid is the asset. The liquidity of the product is the speed of its implementation using nominal price without additional discounts.
The ratio shows the ability of the company to meet its current (short-term) obligations using only current assets and characterizes not only company’s current solvency, but also the solvency in case of emergency. The higher is the rate, the better is the solvency of the company.
Both low and high ratios have negative effect. The ratio lower than 1 indicates about high financial risk, which is connected with the fact, that the company is not able to consistently pay its current bills. The ratio more than 3 may testify about the irrational capital structure; overly cautious financial strategy, which may lead to loss of the share in market. However it should be considered, that the ratio value may significantly vary, it depends on the area of activity, structure and quality of the assets etc.
It should be noted, that the ratio doesn’t always give a full picture. Usually the enterprises, which easily receive money from the payment bills, and with low inventory stocks, may safely operate with a lower ratio value, than the companies with high inventory stocks and sales of goods on credit.
For the most full and fair opinion about the company’s financial condition, not only the average values of the indicators should be taken into account, but also the whole set of financial indicators and ratios.
| № | Name | Region | Revenue, mln. RUB, 2014 | Current liquidity ratio, (х) | Solvency index GLOBAS-i® |
|---|---|---|---|---|---|
| 1 | LLC STELLAR INN 6165021405 |
Rostov region | 642,8 | 1,9 | 190 the highest |
| 2 | CJSC STEP PAZZLE INN 7720249869 |
Moscow region | 633,4 | 4,2 | 197 the highest |
| 3 | JSC VESNA INN 4346008642 |
Kirov region | 520,7 | 17,7 | 168 the highest |
| 4 | LLC Kometa-Plus INN 6714015660 |
Smolensk region | 412,1 | 1,6 | 290 high |
| 5 | LLC ZVEZDA INN 5025025461 |
Moscow region | 386,7 | - | 337 satisfactory |
| 6 | LLC 7-YA INN 7602033398 |
Yaroslavl region | 374,8 | 2,8 | 219 high |
| 7 | LLC Hobby World INN 7708812210 |
Moscow | 278,6 | 0,9 | 366 satisfactory |
| 8 | LLC FANTAZER INN 7728557047 |
Moscow | 249,4 | 1,0 | 320 satisfactory |
| 9 | CJSC Ogonek Plant INN 7724003577 |
Moscow | 223,9 | 3,0 | 229 high |
| 10 | LLC Desyatoekorolevstvo INN 7713321088 |
Moscow region | 195,2 | 5,8 | 187 the highest |