
Order a report
Custom-made industry research, company ratings, competitor analysis


Russia takes gold
In 2014 Russia had almost third part of the world gold purchase volume; last year The Russian Federation had spent the largest sum on purchase of precious metal since the collapse of the USSR.
In 2014 the Central Banks around the world bought 461 tons of gold. This is 13% more than in 2013. In January-November 2014 The Central Bank of Russia bought 152 tons of gold for a total amount of USD 6,1 bln. The growth in purchases volume amounted to 123%. Monetary valuation of gold in reserves increased by 13% (as of 01.02.2015 it was USD 49,1 bln.).
The purchasing of gold by The Central Bank of Russia can be explained by the desire to curtail dollar dependence and to support the considerably flagging ruble. However it also should be taken into account the fact that by 2014 results Russia was the second manufacturer of commodities in the world: 272 tons of gold. The first place took China with 465,7 tons and the third place - Australia with 269,7 tons. In 2014 the global gold output amounted to 3 109 tons.
That is why the hasty growth in purchasing of gold is partly explained by purchasing of home-grown metal; such values are not easy to sell abroad because of sanctions imposed by the West due to events in Ukraine.
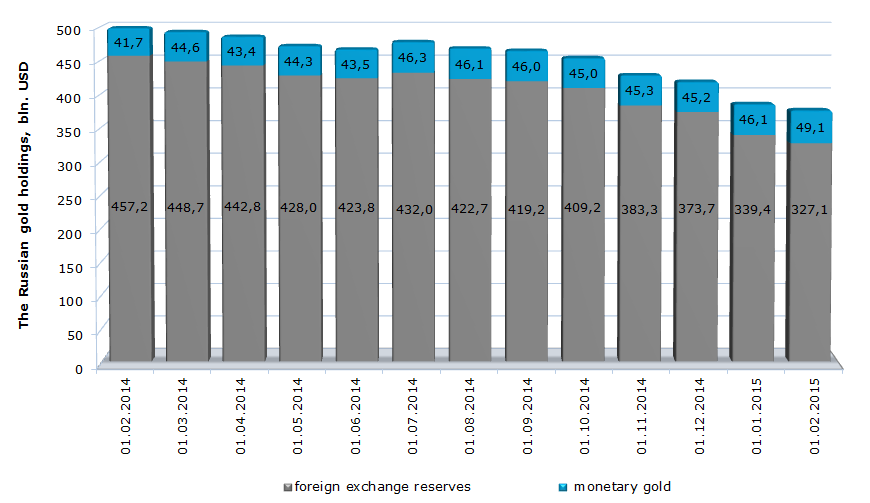
The structure and dynamics of the Russian gold holdings, bln. USD
Unstable position of the Russian economy and currency market has led to decreasing of total gold holdings by 24,6% within a year (as of 01.02.2015, till USD 376,2 bln.). At the same time, the value of monetary gold, in reserves structure, increased within the same period by 17,7% (till USD 49,1 bln.). Thus, we can see the policy of The Central Bank, which is directed on the increasing of gold holdings.