
Order a report
Custom-made industry research, company ratings, competitor analysis


Trends in the extraction of gravel, sand, clay and kaolin
Information agency Credinform represents an overview of trends in the field of the extraction of gravel, sand, clay and kaolin.
Enterprises with the largest volume of annual revenue (TOP-10 and TOP-2000) were selected for the analysis, according to the data from the Statistical Register for the latest available periods (for 2015 and 2016). The analysis was made on the basis of the data of the Information and Analytical system Globas.
Legal forms and unreliable data
The most spread legal form of enterprises in the industry is a limited liability company. Public joint-stock companies and Non-public joint-stock companies also make a significant part. (Picture 1).
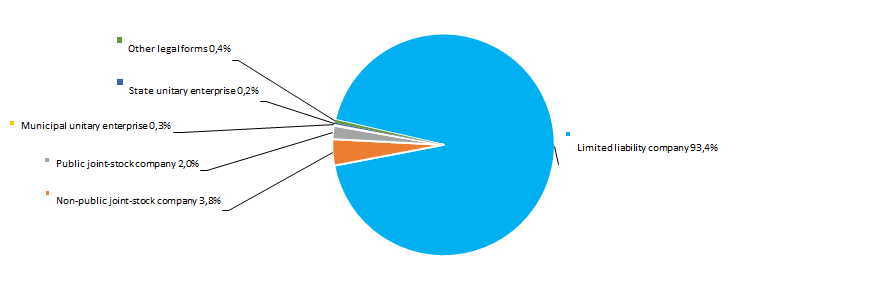 Picture 1. Distribution of TOP-2000 companies by legal forms
According to the results of investigation of the Federal Tax Service of the RF, 4,5% of companies in the industry have records of unreliable data entered into the Unified State Register of Legal Entities. (Picture 2).
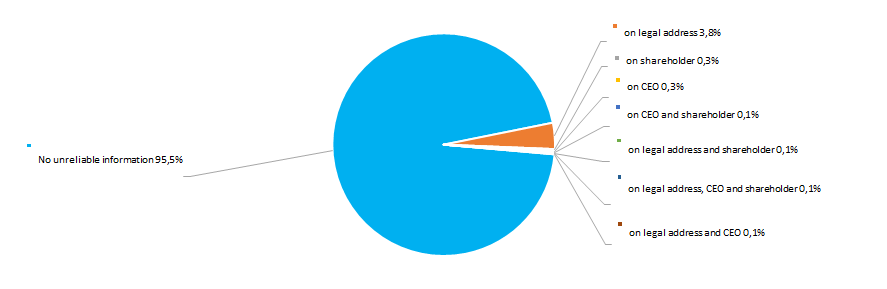 Picture 2. Shares of TOP-2000 companies, having records of unreliable data in the Unified State Register of Legal Entities
Sales revenue
The revenue of 10 industry leaders made 22% of the total revenue of 2000 the largest companies in 2016. It points to a sufficiently high level of competition in the industry. DONSKOI KAMEN LLC became the largest company in terms of revenue in 2016 (Picture 3).
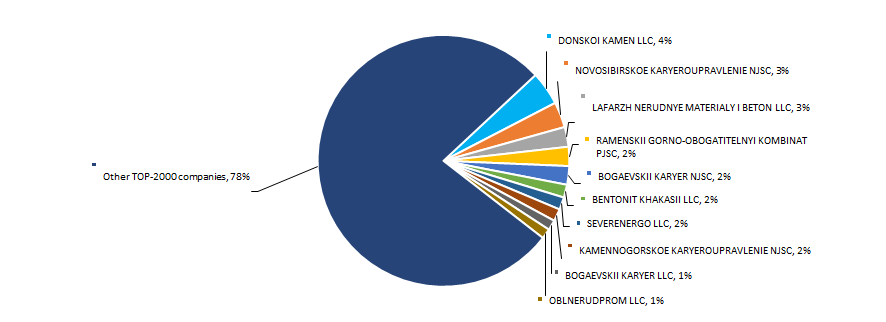 Picture 3. Shares of participation of TOP-10 enterprises in the total revenue of TOP-2000 companies for 2016, %
The best results in the industry in terms of revenue for the ten-year period were achieved in 2008. During the crisis periods in the economy in 2009 -2010 and 2012-2014 there was a decline in the industry average indicators. (Picture 4).
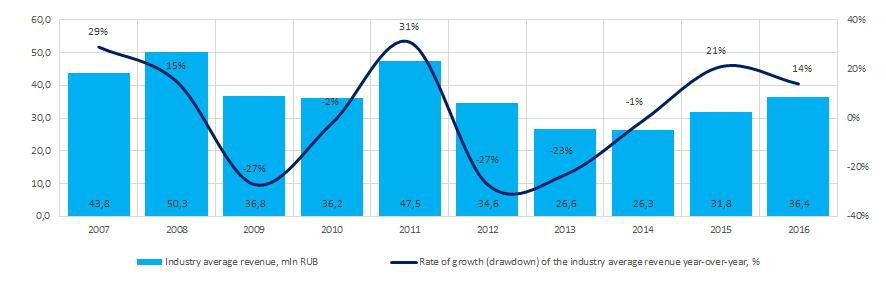 Picture 4. Change in the industry average indicators of revenue of companies in the field of the extraction of gravel, sand, clay and kaolin in 2007 – 2016
 Profit and loss
The volume of profit of 10 industry leaders made 37% of the total profit of TOP-2000 companies in 2016. The leading position in terms of profit volume in 2016 is taken by BOGAEVSKII KARYER NJSC (Picture 5).
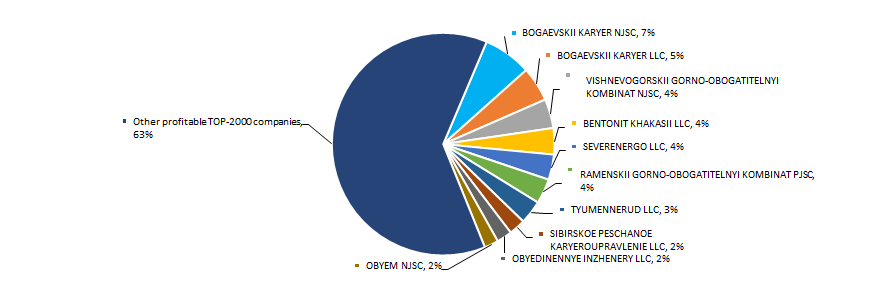 Picture 5. Shares of participation of TOP-10 enterprises in the total volume of profit of TOP-2000 companies for 2016
Industry average values of the profit indicators of companies in the industry for the ten-year period are not stable. Decrease in indicators was observed in 2008 - 2009, 2013 - 2014 against the background of crisis phenomena in the economy. At the same time, in 2009, 2010 and 2014 the indicators had negative values. The industry showed the best results in 2007 (Picture 6).
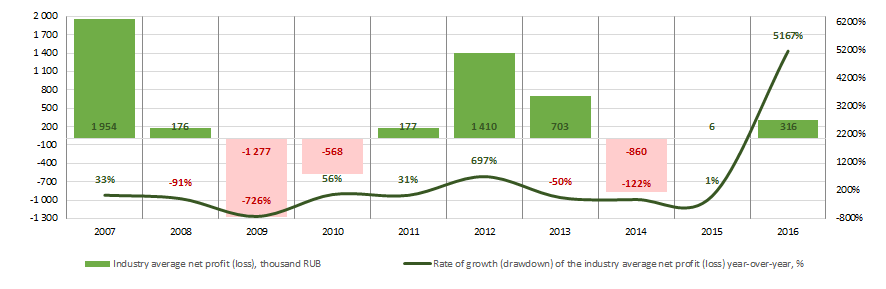 Picture 6. Change in the industry average indicators of profit of companies in the field of the extraction of gravel, sand, clay and kaolin in 2007 – 2016
There were 619 loss-making enterprises observed in 2015 among TOP-2000 companies. In 2016 their number increased to 623 or by 1%. At the same time, the average size of their loss increased by 9%. For the rest of TOP-2000 companies the average profit margin increased by 24% for the same period (Picture 7).
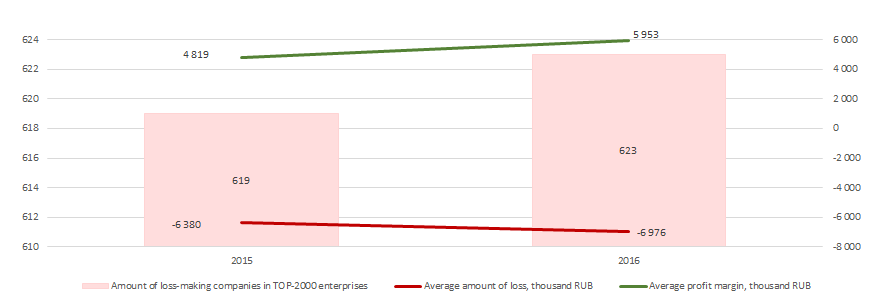 Picture 7. Amount of loss-making companies, average value of loss and profit of TOP-2000 enterprises in 2015 – 2016
Key financial ratios
Over the ten-year period the average industry indicators of the total liquidity ratio were during 8 years below the interval of recommended values – from 1,0 to 2,0. (marked in yellow in the Picture 8).
The total liquidity ratio (the relation of the amount of current assets to short-term liabilities) shows the sufficiency of company’s funds for repayment of its short-term liabilities.
Solvency ratio (the relation of the amount of own capital to the balance sum) shows the company's dependence on external borrowings. Recommended value is > 0.5. The value of the ratio below the minimum value means a strong dependence on external sources of funds’ receipt.
The experts of the Information agency Credinform, taking into account the actual situation both in the economy as a whole and in sectors, has developed and implemented in the Information and analytical system Globas the calculation of practical values of financial ratios that can be recognized as normal for a particular industry. For companies in the field of the extraction of gravel, sand, clay and kaolin the practical value of the solvency ratio is from - 0,04 to 0,87 in 2016.
Over the ten-year period the industry average indicators of the ratio were below the recommended value and in the interval of practical values (Picture 8).
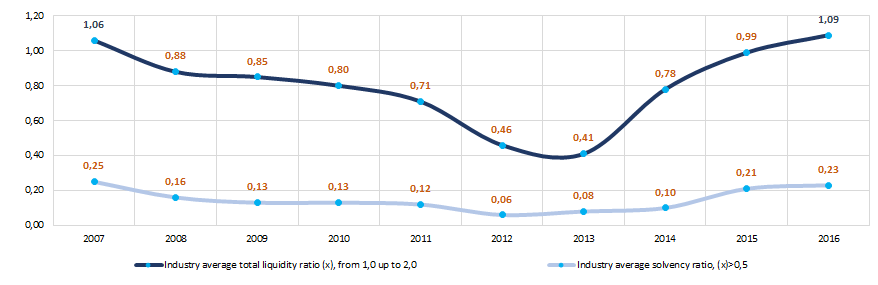 Picture 8. Change in the industry average values of the total liquidity and solvency ratios of companies in the field of the extraction of gravel, sand, clay and kaolin in 2007 – 2016
For the last ten years the instability of return on investment ratio was observed. In periods of crisis phenomena in the economy (in 2009, 2010, 2014, 2015) the indicators decreased up to negative values (Picture 9). The ratio is calculated as the relation of net profit to the sum of own capital and long-term liabilities and demonstrates the return on the equity involved in the commercial activity and the long-term borrowed funds of an organization.
Within the same period the products profitability ratio was rather stable (Picture 9). The highest indicators were in the years 2007, 2012 - 2013. The ratio is calculated as the relation of profit from sales to expenses for ordinary activity. In general, profitability reflects the economic efficiency of production.
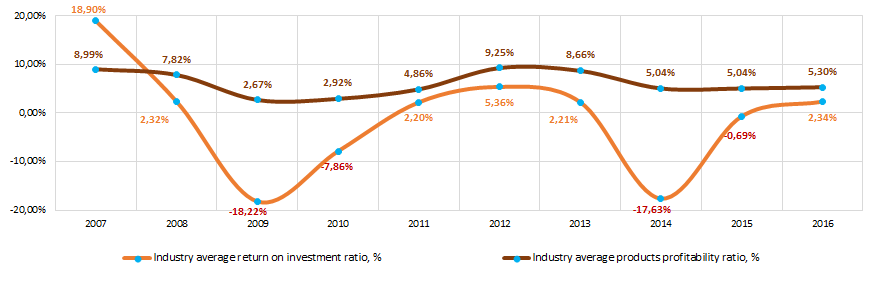 Picture 9. Change in the industry average values of the return on investment and products profitability ratios of companies in the field of the extraction of gravel, sand, clay and kaolin in 2007 – 2016
 Indicators of the asset turnover ratio over a ten-year period demonstrate relative stability with periods of gradual decline and growth (Picture 10).
Asset turnover ratio is calculated as the relation of sales proceeds to the average value of total assets for a period and characterizes the efficiency of use of all available resources, regardless of the sources of their attraction. The coefficient shows how many times a year a complete cycle of production and circulation is made, yielding profit.
Equity turnover ratio is calculated as the relation of revenue to average annual amount of equity and shows the intensity of use of the whole part of assets.
There is a significant decrease in the indicators of this ratio in 2013 - 2016 (Picture 10).
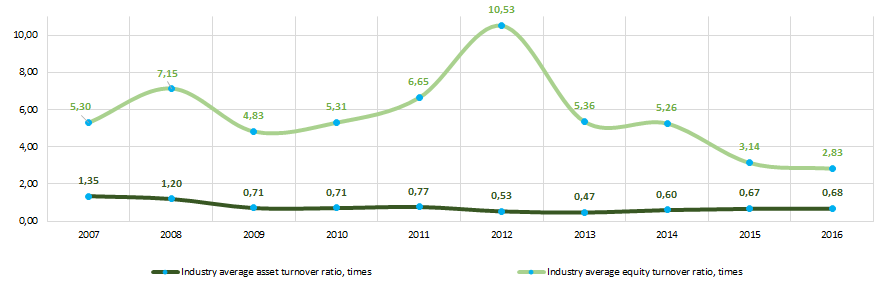 Picture 10. Change in the industry average values of the activity ratios of companies in the field of the extraction of gravel, sand, clay and kaolin in 2007 – 2016
Production structure
The great majority of companies in the TOP-2000 have a broad specialization in the development of gravel and sand quarries, extraction of clay and kaolin (Picture 11).
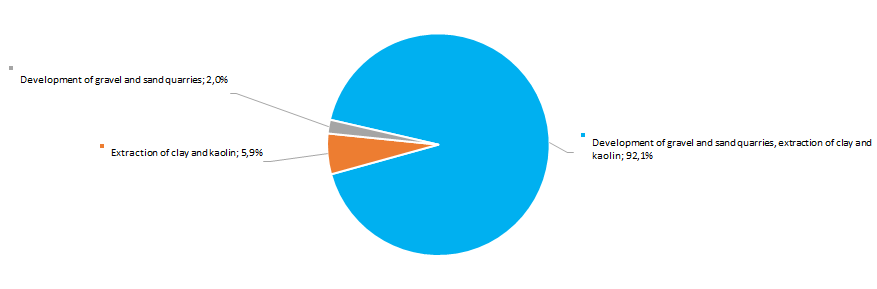 Picture 11. Distribution of TOP-2000 companies by types of output
Dynamics of business activity
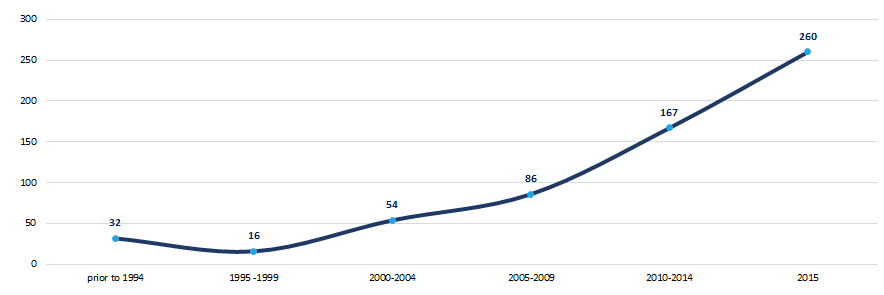
Over the 25-year period the registered companies from TOP-2000 list are unequally distributed by the year of foundation. The largest number of enterprises in the industry was established in 2014 (Picture 12).
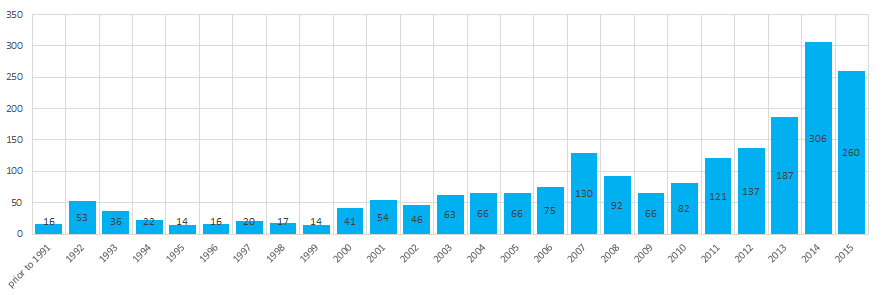 Picture 12. Distribution of TOP-300 companies by years of their foundation
Business took the greatest interest to the extraction of gravel, sand, clay and kaolin in the period after 2010. (Picture 13).
 Picture 13. Average number of TOP-300 companies registered within the year, by periods of their foundation
Main regions of activity
The companies of the industry are unequally distributed across the country. Their largest number is registered in Krasnodar territory by the location of the largest deposits of the corresponding natural resources (Picture 14). TOP-2000 companies are registered in 84 regions of Russia.
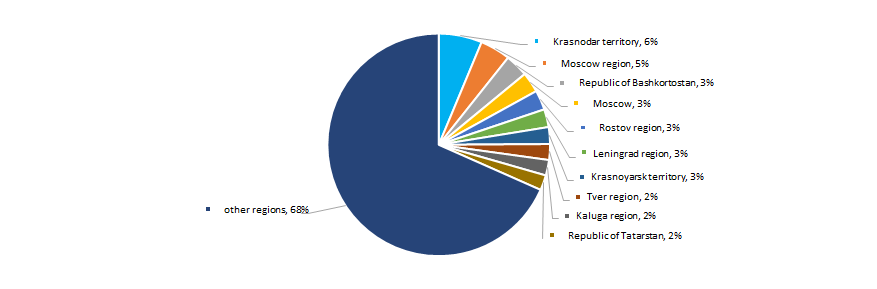 Picture 14. Distribution of TOP-2000 companies by regions of Russia
The great majority of companies in the industry is concentrated in the Central Federal District of the country (Picture 15).
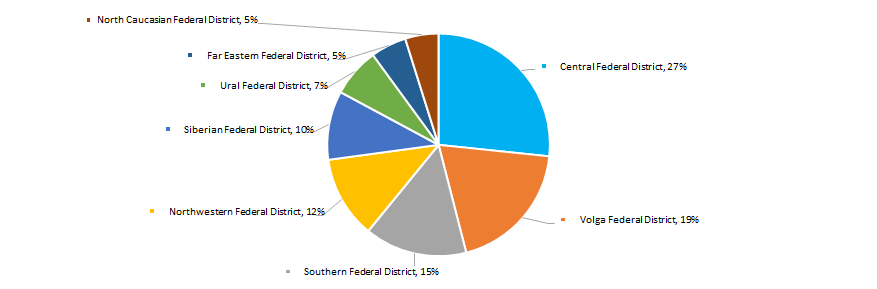 Picture 15. Distribution of TOP-2000 companies by federal districts of Russia
The share of companies with branches or representative offices from TOP-2000 enterprises is 1,6%.
Activity of participation in arbitration proceedings
More than 40% of companies of the industry do not participate in arbitration proceedings. The same part of companies participate in a negligible number of arbitration cases. (Picture 16).
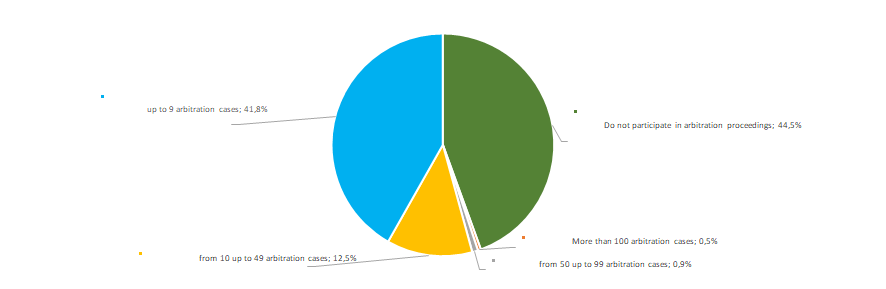 Picture 16. Distribution of TOP-2000 companies by participation in arbitration proceedings
Reliability index
In terms of the presence of signs of «fly-by-night companies» or unreliable organizations, the great majority of enterprises of the industry demonstrate an extremely low risk of cooperation (Picture 17).
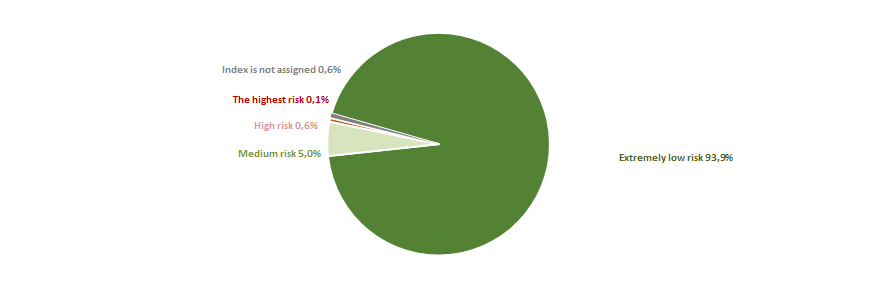 Picture 17. Distribution of TOP-2000 companies by reliability index
Financial position score
An assessment of the financial position of companies in the industry shows that the more than half of enterprises are in an unstable and critical financial situation (Picture 18).
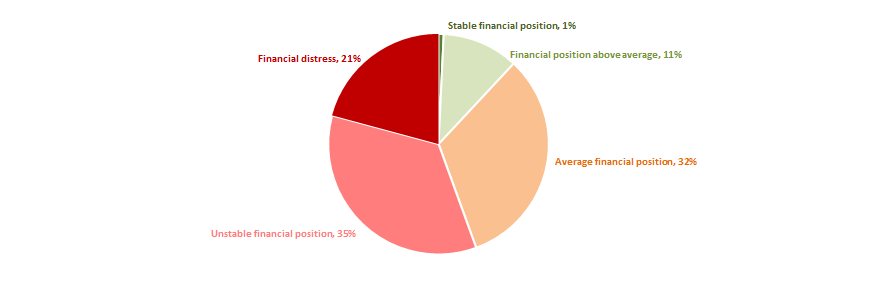 Picture 18. Distribution of TOP-2000 companies by financial position score
Liquidity index
Almost a third of companies of the industry (32%) show the highest level of bankruptcy risk in the short-term period (Picture 19).
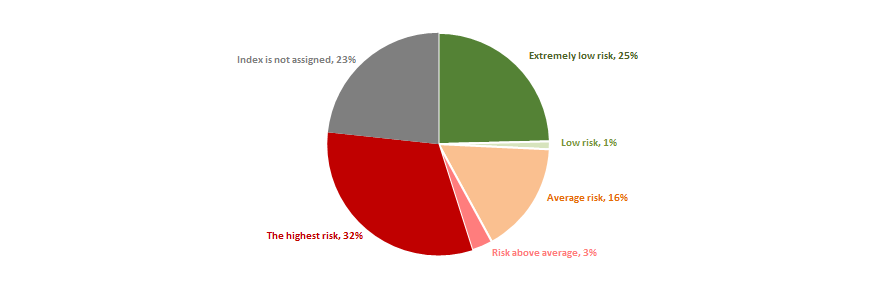 Picture 19. Distribution of TOP-300 companies by liquidity index
Solvency indexGlobas
Almost half of the companies from 2000 the largest enterprises have got Adequate/Weak Solvency index Globas. More than a fifth of companies have got Unsatisfactory/Poor and Insufficient Solvency index Globas (Picture 20).
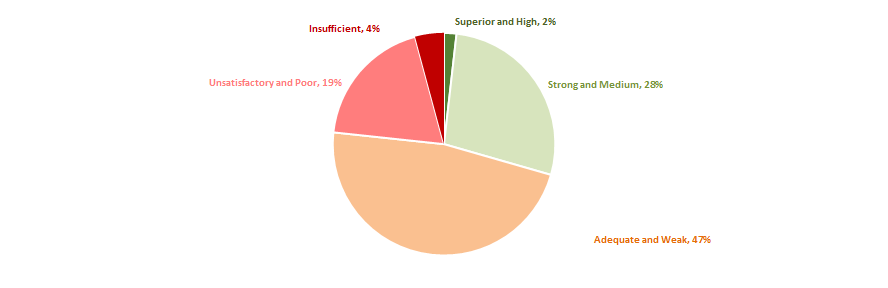 Picture 20. Distribution of TOP-2000 companies by Solvency index Globas
Thus, a comprehensive assessment of enterprises on the extraction of gravel, sand, clay and kaolin, taking into account the main indices, financial indicators and ratios, points to unfavorable trends in this field of activity.