
Order a report
Custom-made industry research, company ratings, competitor analysis


Activity trends of the largest real economy companies of the Republic of Tatarstan
Information Agency Credinform presents a review of activity trends of the largest real economy companies of the Republic of Tatarstan.
The companies from the Republic of Tatarstan with the highest volume of annual revenue (TOP-10 and TOP-1000) have been selected for the ranking, according to the data from the Statistical Register for the latest available accounting periods (2014 — 2016). The analysis was based on the data from the Information and Analytical system Globas.
Net assets is an indicator of fair value of corporate assets that is calculated annually as assets on balance less company’s liabilities. Net assets value is negative (insufficiency of property) if liabilities are larger than the property value.
| No. in TOP-1000 | Name, INN, region, key type of activity | Net assets, million RUB | Solvency index Globas | ||
| 2014 | 2015 | 2016 | |||
| 1. | Tatneft named after V.D. Shashin PJSC INN 1644003838 Extraction of crude petroleum and associated petroleum gas |
485 094 | |
|
140 Superior |
| 2. | TELECOM-MANAGEMENT LLC INN 1655061006 Investment in securities Since 13.03.2018 is in process of reorganization in the form of accession to TAIF JSC INN 1655020761 |
46 767 | |
|
600 Insufficient |
| 3. | Nizhnekamskneftekhim PJSC INN 1651000010 Production of synthetic rubber in primary forms |
68 236 | |
|
138 Superior |
| 4. | TRANSNEFT - PRIKAMYE NJSC INN 1645000340 Oil transportation via pipelines |
87 529 | |
|
164 Superior |
| 5. | State housing fund under President of the Republic of Tatarstan INN 1655065113 Real estate management on a fee or contract basis |
59 076 | |
|
260 Medium |
| 996. | BANKING DEBT CENTER LLC INN 7730126601 Investment in securities Since 26.03.2018 it is in process of reorganization in the form of merger of LIRIDAN LLC INN 1655270345 |
-228 | |
|
323 Adequate |
| 997. | ELASTIC PLANT LLC INN 1651041168 Manufacture of footwear |
-1 977 | |
|
282 Medium |
| 998. | MANAGING COMPANY TECHNOPOLIS NOVAYA TURA LLC INN 1655228689 Buying and selling of own real estate |
-1 564 | |
|
310 Adequate |
| 999. | KAZSTROIINVEST NJSC INN 1660054950 Leasing and operating of own or leased real estate |
-4 436 | |
|
250 Medium |
| 1000. | FORD SOLLERS HOLDING LLC INN 1646021952 Manufacture of motor vehicles |
5 492 | |
|
334 Adequate |
![]() — growth compared to prior period,
— growth compared to prior period, ![]() — decline compared to prior period.
— decline compared to prior period.
Average values of net assets of TOP-1000 companies tend to increase during the last 3 years (Picture 1).
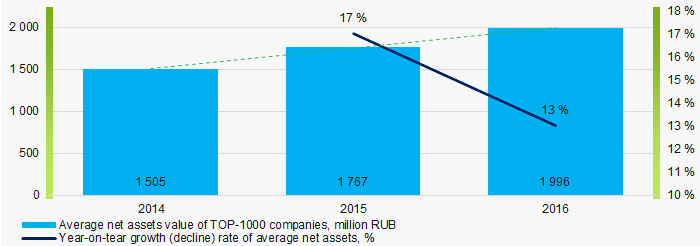 Picture 1. Change in average net assets value of TOP-1000 companies in 2014 — 2016
Sales revenue
In 2016 sales revenue of 10 industry leaders amounted to 37% of total revenue of TOP-1000 companies. This is an indicator of concentration of large companies in the Republic of Tatarstan (Picture 2).
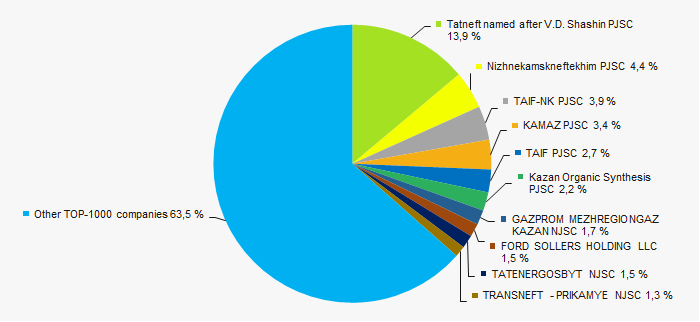 Picture 2. TOP-10 companies by their share in 2016 total revenue of TOP-1000 companies
In general, revenue tends to increase (Picture 3).
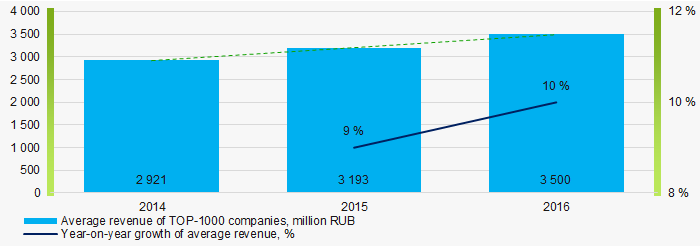 Picture 3. Change in average revenue of TOP-1000 companies in 2014 — 2016
Profit and loss
In 2016 profit of 10 industry leaders amounted to 72% of total profit of TOP-1000 companies (Picture 4).
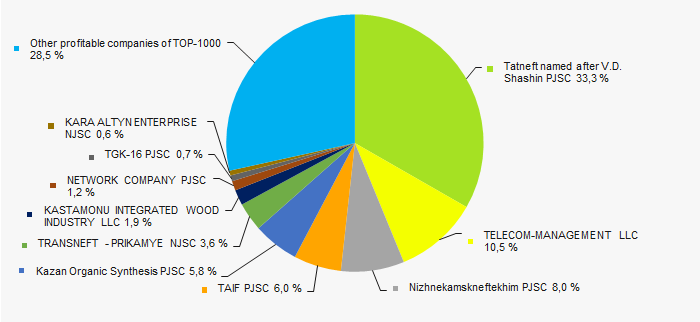 Picture 4. TOP-10 companies by their share in 2016 total profit of TOP-1000 companies
Average net profit values of TOP-1000 companies within the last 3 years tend to increase, as well as average loss value (Picture 5).
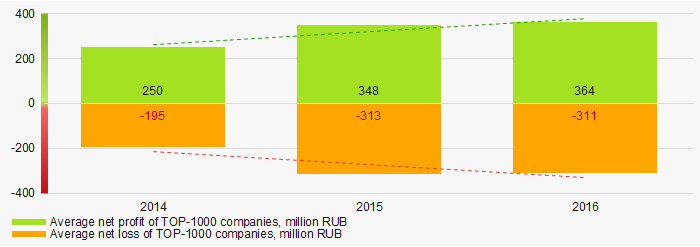 Picture 5. Change in average net profit and loss of TOP-1000 companies in 2014 — 2016
Key financial ratios
Total liquidity ratio (a ratio of current assets to current liabilities) reveals the sufficiency of a company’s funds for meeting its short-term liabilities.
During the last 3 years average values of total liquidity ratio were within the recommended value — from 1,0 to 2,0 (Picture 6). In general, the ratio value tends to increase.
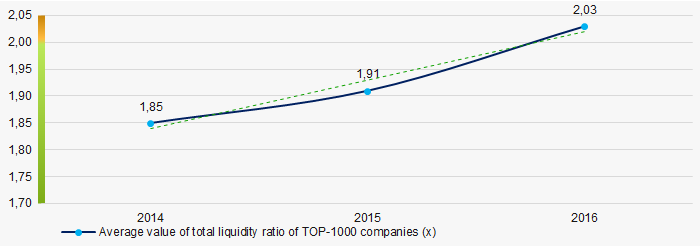 Picture 6. Change in average values of total liquidity ratio of TOP-1000 companies in 2014 — 2016
The return on investment ratio is a ratio of net profit to total equity and noncurrent liabilities, and it demonstrates benefit from equity engaged in business activity and long-term raised funds of the company.
The return on investment ratio tended to increase during the last 3 years (Picture 7).
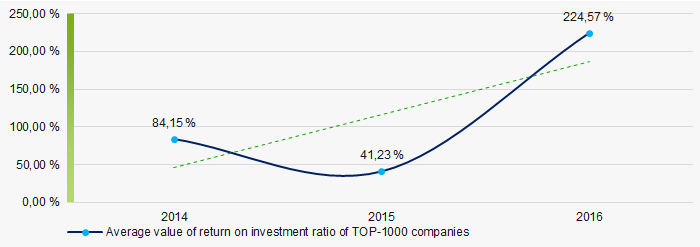 Picture 7. Change in average values of return on investment ratio of TOP-1000 companies in 2014 — 2016
Assets turnover ratio is a ratio of sales revenue to average total assets for the period, and it measures resource efficiency regardless of the sources. The ratio indicates the number of profit-bearing complete production and distribution cycles per annum.
During the last 3 years, this activity ratio tended to decrease (Picture 8).
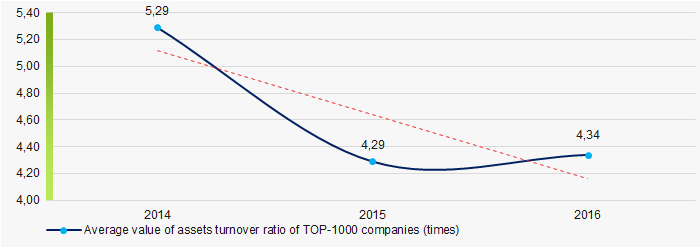 Picture 8. Change in average values of assets turnover ratio of TOP-1000 companies in 2014 — 2016
Activities structure
Crude petroleum extraction companies have the largest share in total revenue of TOP-1000 companies (Picture 9).
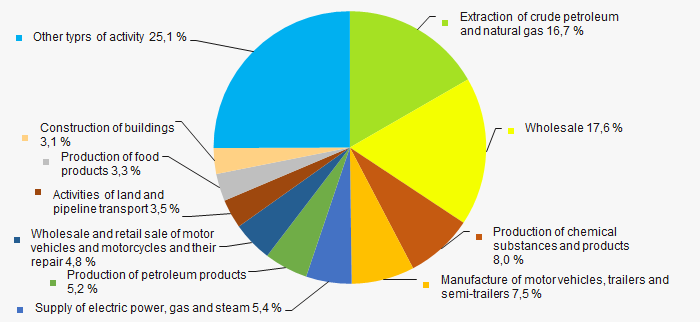 Picture 9. Types of activity by their share in total revenue of TOP-1000 companies, %
45% companies of TOP-1000 are included in the register of small and medium-sized businesses of the Federal Tax Service of the Russian Federation (Picture 10).
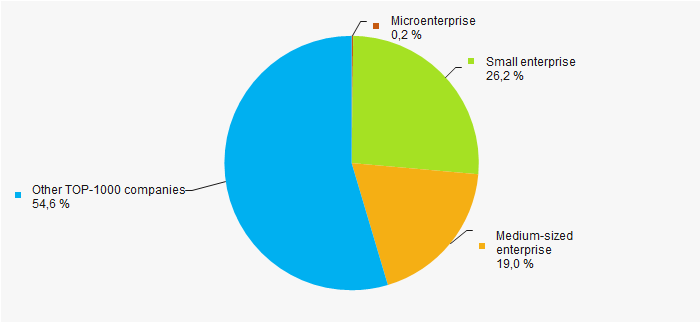 Picture 10. Shares of small and medium-sized enterprises in TOP-1000 companies, %
Financial position score
Assessment of financial state of TOP-1000 companies indicates that most of the companies have a stable and above average financial standing (Picture 11).
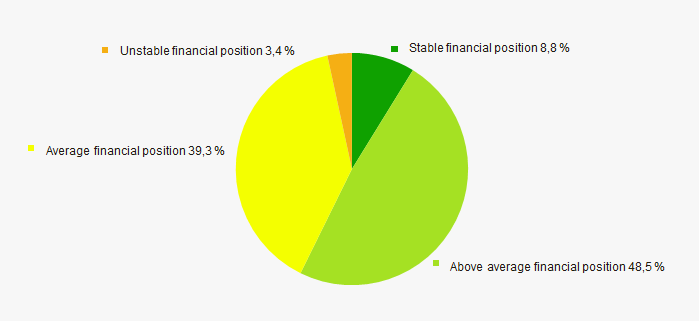 Picture 11. TOP-1000 companies by their financial position score
Solvency index Globas
Most of TOP-1000 companies have got a superior, high, strong and medium Solvency index Globas, that indicates their capability to meet liabilities timely and in full (Picture 12).
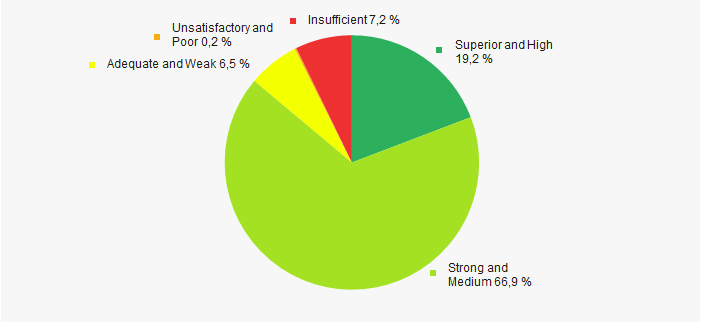 Picture 12. TOP-1000 companies by Solvency index Globas
Conclusion
A comprehensive assessment of the largest real economy companies of the Republic of Tatarstan, that considers key indexes, financial figures and ratios, is indicative of predominance of positive trends within the sector. However, increase in net loss and decrease of business activity ratio are the alarming factors.