
Order a report
Custom-made industry research, company ratings, competitor analysis


Return on assets of security companies
Information agency Credinform has prepared a ranking of the largest Russian security companies. The largest enterprises (TOP-10) in terms of annual revenue were selected according to the data from the Statistical Register for the available periods (2016-2018). Then the companies were ranged by return on assets ratio (Table 1). The analysis was based on the data from the Information and Analytical system Globas.
Return on assets (%) is calculated as the relation of the sum of net profit and interest payable to the total assets value of a company and shows how many monetary units of net profit are earned by every unit of total assets.
The ratio characterizes the effectiveness of using by the company of its resources. The higher is the ratio value, the more effective is business, that is the higher the return per every monetary unit invested in assets.
However, it is necessary to take into account that the book value of assets may not correspond to their current market value. For example, under the influence of inflation, the book value of fixed assets will increasingly be underestimated in time, that will lead to an overestimation of the return on assets. Thus, it is necessary to take into account not only the structure, but also the age of the assets.
It should be also taken into account the dynamics of this indicator. Its consistent decline indicates a drop in asset utilization.
For the most full and fair opinion about the company’s financial position the whole set of financial indicators and ratios should be taken into account.
| Name, INN, region | Revenue, million RUB | Net profit (loss), million RUB | Return on assets,% | Solvency index Globas | |||
| 2017 | 2018 | 2017 | 2018 | 2017 | 2018 | ||
| 1 | 2 | 3 | 4 | 5 | 6 | 7 | 8 |
| PSC BASTION LLC ИНН 8904047159 Yamalo-Nenets Autonomous Okrug |
|
|
|
|
|
|
136 Superior |
| CHOO UPRAVLENIE PO OKHRANE OByEKTOV GMK NORILSKII NIKEL LLC ИНН 7705393628 Moscow |
|
|
|
|
|
|
191 High |
| LUKOM-A-PERM Agency LLC ИНН 5902189473 Perm Territory |
|
|
|
|
|
|
200 Strong |
| THE PRIVATE SECURITY COMPANY RZD-GUARD LLC ИНН 7701859844 Moscow |
|
|
|
|
|
|
202 Strong |
| AN-SECURITY NORTH-WEST LLC ИНН 7806302994 St. Petersburg |
|
|
|
|
|
|
180 High |
| KENNARD PSC LTD ИНН 1655030632 Republic of Tatarstan |
|
|
|
|
|
|
181 High |
| PSC VITYAZ LLC ИНН 1649005010 Republic of Tatarstan |
|
|
|
|
|
|
191 High |
| PSC MEGUR LLC ИНН 7724287600 Moscow |
|
|
|
|
|
|
237 Strong |
| PSC POLYUS SHCHIT LLC ИНН 2463069959 Krasnoyarsk region |
|
|
|
|
|
|
257 Medium |
| LLC ALROSA-Okhrana ИНН 1433018056 The Republic of Sakha (Yakutia) |
|
|
|
|
|
|
220 Strong |
| Average value for TOP-10 companies | |
|
|
|
|
|
|
| Average industry value | |
|
|
|
|
|
|
![]() growth of indicator in comparison with prior period,
growth of indicator in comparison with prior period, ![]() decline of indicator in comparison with prior period
decline of indicator in comparison with prior period
The average value of return on assets for TOP-10 companies is lower than average industry value: in 2018, six companies improved the results.
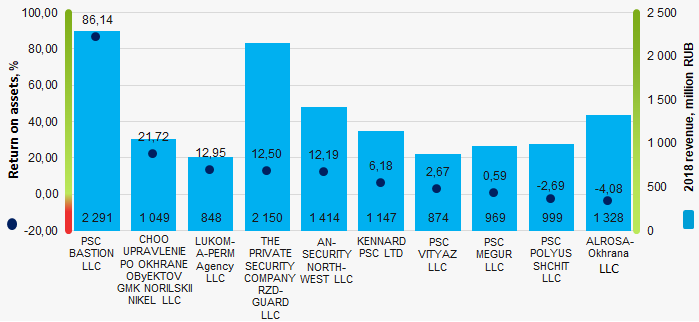 Picture 1. Return on assets and revenue of the largest Russian security companies (ТОP-10)
Within 10 years, the average industry indicators of return on assets ratio showed the growing tendency. (Picture 2).
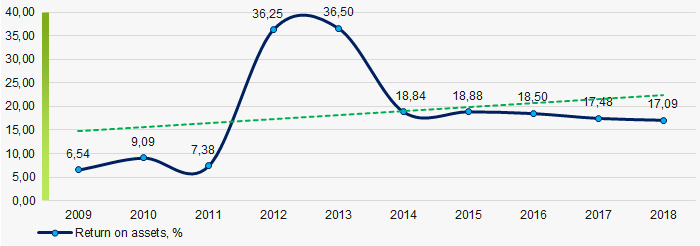 Picture 2. Change in average industry values of return on assets of Russian security companies in 2009 – 2018