
Order a report
Custom-made industry research, company ratings, competitor analysis


Activity trends of Nizhniy Novgorod companies
Information agency Credinform has observed trends in the activity of the largest real economy companies of Nizhniy Novgorod region. Enterprises with the largest volume of annual revenue (TOP-10 and TOP-1000), were selected for the analysis, according to the data from the Statistical Register for the latest available periods (for 2012-2017). The analysis was made on the basis of the data of the Information and Analytical system Globas.
Net assets -indicator, reflecting the real value of company's property, is calculated annually as the difference between assets on the enterprise balance and its debt obligations. The indicator of net assets is considered negative (insufficiency of property), if company’s debt exceeds the value of its property.
| № in TOP-1000 | Name, INN, main type of activity | Net assets value, bln RUB | Solvency index Globas | ||||
| 2013 | 2014 | 2015 | 2016 | 2017 | |||
| 1 | 2 | 3 | 4 | 5 | 6 | 7 | 8 |
| 1 | AO TRANSNEFT-VERKHNYAYA VOLGA INN 5260900725 Oil transportation by pipeline |
|
|
|
|
|
180 High |
| 2 | JSC VYKSA STEEL WORKS INN 5247004695 Manufacture of steel pipes, hollow profiles and fittings |
|
|
|
|
|
174 Superior |
| 3 | LLC LUKOIL-NIZHEGORODNEFTEORGSINTEZ INN 5250043567 Manufacture of oil products |
|
|
|
|
|
195 High |
| 4 | JSC IDGC of Centre and Volga Region INN 5260200603 Power transmission and technological connection to distribution systems |
|
|
|
|
|
162 Superior |
| 5 | LLC RUSVINYL INN 5262218620 Manufacture of basic chemicals, fertilizers and nitrogen compounds, plastics and synthetic rubber in primary forms |
|
|
|
|
|
272 Medium |
| 996 | LLC A.S.& PALITRA INN 5012049730 Manufacture of wallpapers |
|
|
|
|
|
337 Adequate |
| 997 | HYGIENE TECHNOLOGIES LTD INN 5261058974 Manufacture of paper products of utility and sanitary-hygienic purpose |
|
|
|
|
|
277 Medium |
| 998 | LLC GAZ GROUP INN 7730522644 Market situation survey and public opinion research |
|
|
|
|
|
285 Medium |
| 999 | LLC KSTOVO INDUSTRIAL PARK 1 INN 5260200272 Site preparation |
|
|
|
|
|
283 Medium |
| 1000 | JSC NIZHEGORODSKY MACHINE BUILDING PLANT INN 5259008768 Manufacture of weapons and ammunition |
|
|
|
|
|
232 Strong |
![]() — growth of the indicator to the previous period,
— growth of the indicator to the previous period, ![]() — decline of the indicator to the previous period.
— decline of the indicator to the previous period.
For a five-year period average amount of net assets of TOP-1000 companies have increasing tendency (Picture 1).
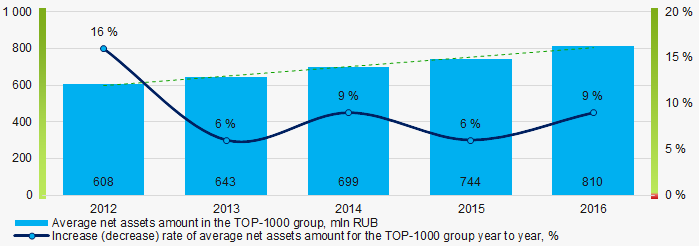 Picture 1. Change in TOP-1000 average indicators of the net asset amount in 2012 – 2016
 Besides, share of companies with insufficiency of property in the TOP-1000 has grown for the last five years (Picture 2).
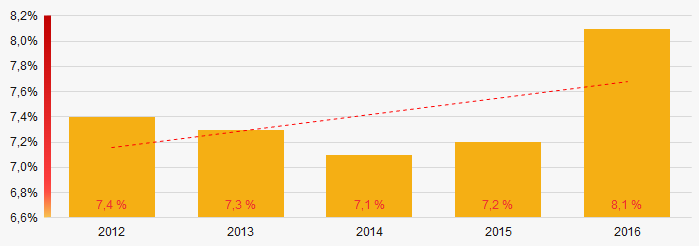 Picture 2. Shares of companies with negative values of net assets in TOP-1000 companies
Sales revenue
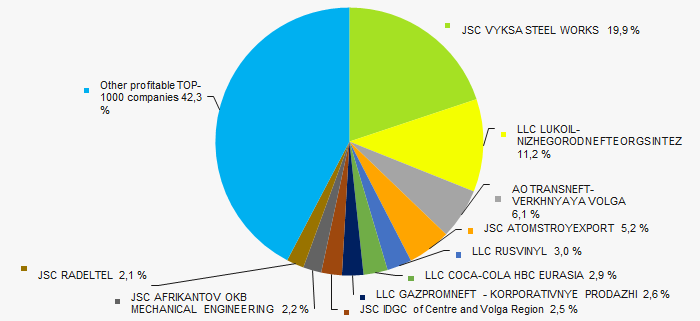
The revenue of 10 leaders of the industry made 41% of the total revenue of TOP-1000 companies in 2016(Picture 3). It demonstrates concentration of large companies in Nizhniy Novgorod region
 Picture 3. Shares of participation of TOP-10 companies in the total revenue of TOP-1000 companies for 2016
In general, an increasing tendency in volume revenue is observed (Picture 4).
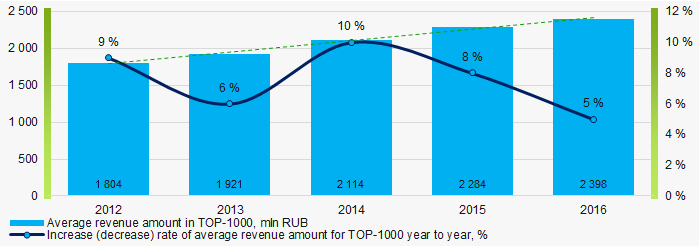 Picture 4. Change in the average revenue of TOP-1000 companies in 2012 – 2016
Profit and losses
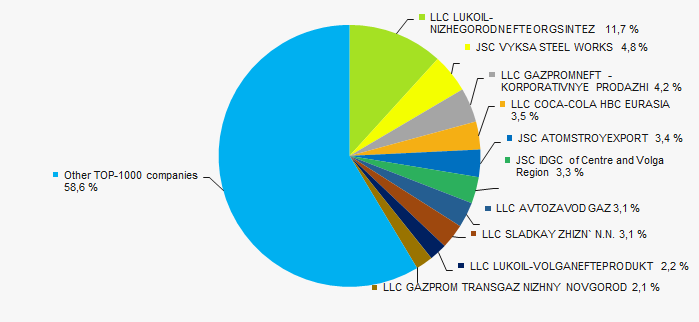
The profit volume of 10 leading enterprises in 2016 made 58% of the total profit of TOP-1000 companies (Picture 5).
 Picture 5. Share of participation of TOP-10 companies in the total volume of profit of TOP-1000 companies for 2016
Over a five-year period, the average values of net profit indicators of TOP-1000 companies tend to increase. Besides, the average value of net loss decreases (Picture 6).
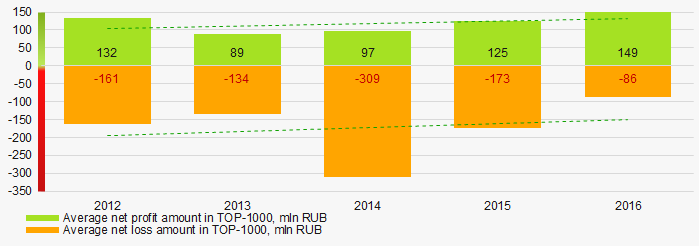 Picture 6. Change in the average indicators of profit and loss of TOP-1000 companies in 2012 – 2016
Key financial ratios
Over the five-year period the average indicators of the current liquidity ratio of TOP-1000 were above the range of recommended values – from 1,0 up to 2,0 with increasing tendency (Picture 7).
The current liquidity ratio (the relation of the amount of current assets to short-term liabilities) shows the sufficiency of company’s funds for repayment of its short-term liabilities.
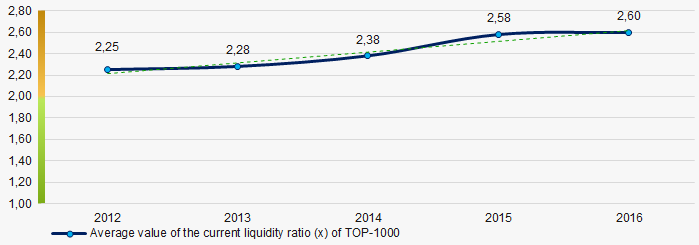 Picture 7. Change in the average values of the current liquidity ratio of TOP-1000 companies in 2012 – 2016
Decreasing tendency in the indicators of the return on investment ratio has been observed for five years (Picture 8).
The ratio is calculated as the relation of net profit to the sum of own capital and long-term liabilities and demonstrates the return on the equity involved in the commercial activity of own capital and the long-term borrowed funds of an organization.
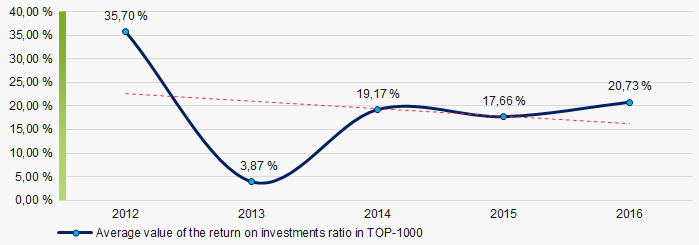 Picture 8. Change in the average values of the return on investment ratio of TOP-1000 companies in 2012 – 2016
Asset turnover ratio is calculated as the relation of sales revenue to the average value of total assets for a period and characterizes the efficiency of use of all available resources, regardless of the sources of their attraction. The ratio shows how many times a year a complete cycle of production and circulation is made, yielding profit.
This business activity ratio showed a tendency to decrease for a five-year period (Picture 9).
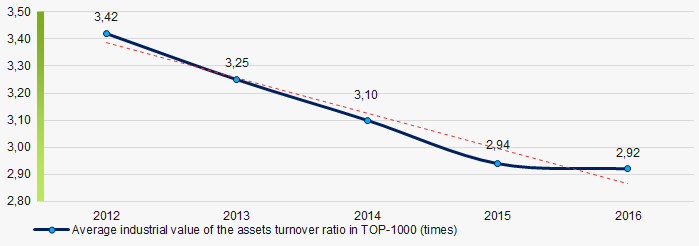 Picture 9. Change in the average values of the assets turnover ratio of TOP-1000 companies in 2012 – 2016
Production structure
The largest share in the total revenue of TOP-1000 is owned by companies, specializing in wholesale and manufacture of oil products (Picture 10).
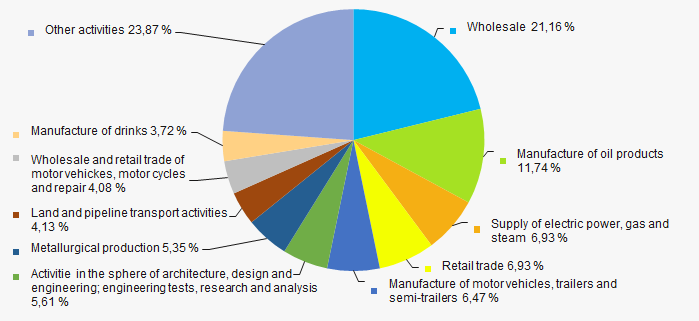 Picture 10. Distribution of companies by types of output in the total revenue of TOP-1000, %
61% of TOP-1000 companies are registered in the Register of small and medium enterprises of the Federal Tax Service of the RF (Picture 11).
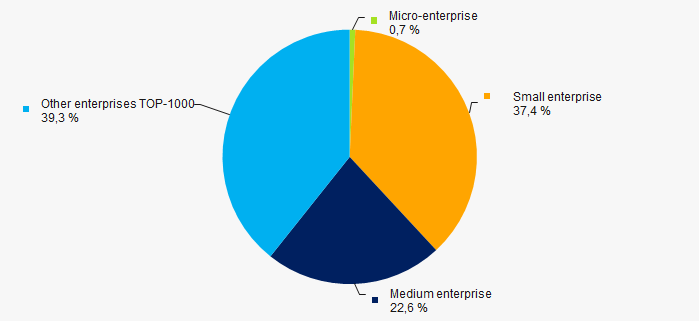 Picture 11. Shares of small and medium enterprises in TOP-1000 companies, %
Financial position score
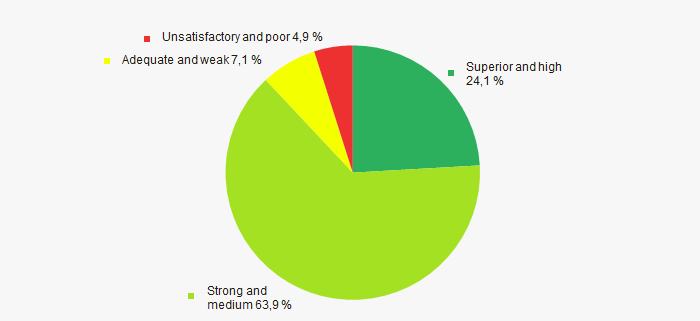
An assessment of the financial position of TOP-1000 companies shows that the largest number is in a stable financial position and above the average. (Picture 12).
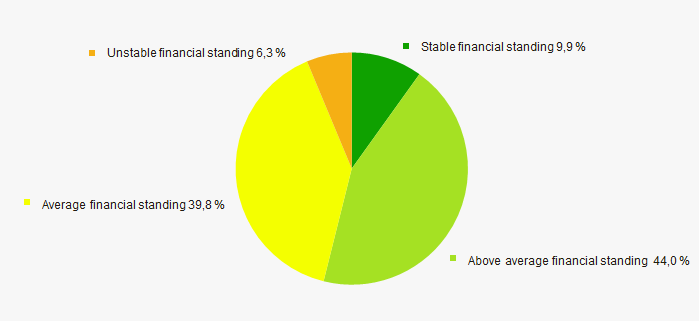 Picture 12. Distribution of TOP-1000 companies by financial position score
Solvency index Globas
Most of TOP-1000 companies have got from Medium to Superior Solvency index Globas, that points to their ability to repay their debts in time and fully (Picture 13).
 Picture 13. Distribution of TOP-1000 companies by solvency index Globas
 Conclusion
Comprehensive assessment of the activity of largest companies of real sector of economy of Nizhniy Novgorod region, taking into account the main indexes, financial indicators and ratios, demonstrates the presence of favorable trends. However, among negative factors are increase of share of companies with insufficiency of property, decreasing indicators of return on investment and return on assets ratios.
According to the data from the Federal State Statistics Service, tendency for slight increase of the Industrial production index is observed in Nizhniy Novgorod region in 2017 – 2018 (Picture 14). In 2017 industrial production has 1% decreased at average, and for 7 months of 2018 – decrease amounted to 1,8%. In general, for the period of 2017 – 2018 industrial production has 1,3% decreased.
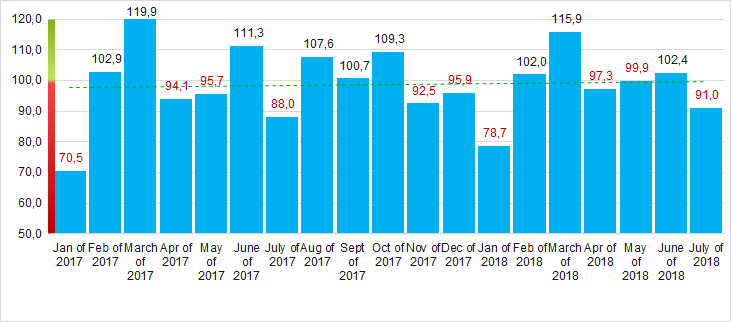 Picture 14. Industrial production index in Nizhniy Novgorod region in 2017 – 2018, month to month (%)