Ranking
Profitability of operating profit before payment of taxes and interest (margin EBIT) of railway rolling stock manufacturers in the Russian Federation

Information agency Credinform has prepared ranking of railway rolling stock manufacturers in the Russian Federation. The ranking includes the largest enterprises and is based on revenue as stated in the Statistics register, with the reference period of 2011. Companies were ranged by descending profitability of operating profit before payment of taxes and interest on the credits (margin EBIT).

Margin EBIT (%) – the ratio of profit before tax and interest on borrowed funds to sales proceeds. The recommended value of margin EBIT should be at least positive number. However it doesn’t guarantee net profit – after accounting of interest to creditors, especially, if company has significant debts, there can be loss. The higher the ratio, the bigger the probability that company will show net profit. This ratio lets to compare companies not taking into account tax payments and the value of loan portfolio, thus the total efficiency of uses by organization its resources and productivity of company's financial management is estimated.

Table 1. Operating margin before tax (Margin EBIT) TOP-10 manufacturers of railway rolling stock in the Russian Federation
NameINNRegionTurnover 2011, mln. RUBMargin EBIT, %Solvency index GLOBAS-i®
1 JSC "Metrovagonmash" 5029006702 Moscow region 15 330,8 19,86 150(the highest)
2 JSC «Altaivagon» 2208000010 Altai territory 17 905,9 16,46 228(high)
3 JSC Research and PC Uralvagonzavod 6623029538 Sverdlovsk region 67 826,7 15,96 211(high)
4 ZAO "Promtractor Vagon" 2128701370 The Republic of Chuvashia 10 600,7 12,56 267(high)
5 JSC Holding Company "Kolomensky zavod" 5022013517 Moscow region 12 375,0 9,27 190(the highest)
6 Private Company " Management Company "Bryansk Engineering Works" 3232035432 Bryansk region 11 838,9 8,95 273(high)
7 ZAO «TransMashHolding» 7723199790 Moscow 65 774,8 5,8 192(the highest)
8 JSC «Demikhovsky engineering plant» 5073050010 Moscow region 9 133,5 5,58 208(high)
9 JSC «Joint-Stock Company Railwaycar-Building Works Tver» 6902008908 Tver region 20 555,1 5,43 247(high)
10 JSC "Zavod metalloconstructsiy" 6449008704 Saratov region 10 137,5 3,43 194(the highest)

Diagram 1. Margin EBIT, revenue and solvency index GLOBAS-i® TOP-10 manufacturers of railway rolling stock in the Russian Federation

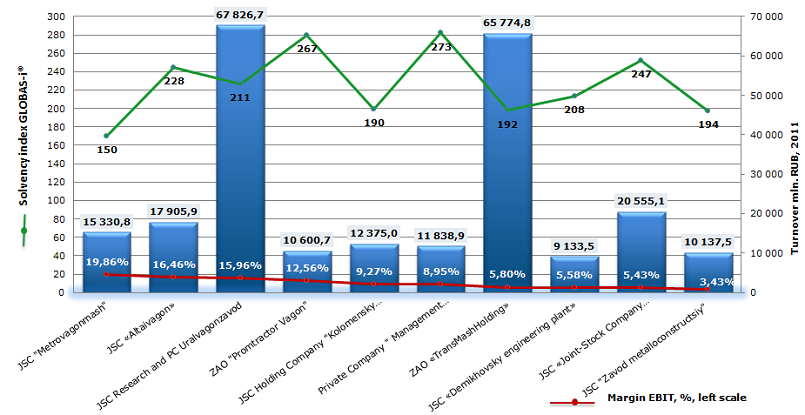
Total turnover of TOP-10 companies by the results of 2011 financial year is 241,48 bln. RUB. The average value of margin EBIT – 10,3%.

As we can see on diagram, two enterprises are notable by annual turnover: OJSC Research and PC Uralvagonzavod (manufactures tank cars, platform-cars, hopper cars) and ZAO Transmashholding (main and industrial locomotives, mainline and shunting locomotives, locomotive and marine diesel engines, freight and passenger cars, electric trains and subway cars), with the revenue 67 827 mln. RUB and 65 775 mln. RUB respectively. UralVagonZavod showed margin EBIT value more than in average 10 largest manufacturers of railway rolling stock in RF – 16%, Transmashholding less – 5,8%.

Besides OJSC Research and PC Uralvagonzavod, the highest value of margin EBIT have the following companies: JSC Metrovagonmash (19,9%) - produce cars for subways of Moscow, Saint-Petersburg, Baku, Tbilisi, Kharkov, Budapest, Prague and other Russian cities, near and far abroad; JSC Altaivagon (16,5%) – one of the largest Russian plants for production of rail freight rolling stock - tanks, platforms, etc.

However these companies and other enterprises from TOP-10 list fall into the highest and high value of independent solvency index GLOBAS-i® of Information agency Credinform. That speaks about ability of companies to meet debt obligations on time and in full. Risk of non-performance of debts is minimum or inconsiderable. Such situation can be explained by the high level of orders on railway rolling stock by JSC "RZD", urban subways, oil, coal and other companies from different industries at rather high depreciation percent of existing park.

Herald
The most attractive regions and industries from the point of view of companies’ solvency

Information agency Credinform is introducing the attractiveness rating of regions and economic industries from the point of view of companies’ solvency.

The regions with the greatest number of companies which have the highest solvency index GLOBAS-i , are Rostov Region (810 companies), Sverdlovsk Region (526) и Novosibirsk Regions (493). There are no companies in Republic of Ingushetia, satisfying the requirements for the assignment of highest index. There are only two most solvent companies in the Chechen Republic and the same in the Trans-Baikal Territory Agin-Buryat district.
The largest amount of most solvent companies is at Rostov Region, where the highest GLOBAS-i index is appropriated to 0,67% of active subjects from the total amount of enterprises in the region. It is slightly less of such companies in Stavropol region - 0,52% and in Sakhalin Region - 0,42%. In Saint-Petersburg there is only 0,16% of companies with the highest solvency index, in Moscow a little more – 0,18%. Such situation can be explained by widespread activity of fly-by-night companies in large cities. Besides, these regions have traditionally maximum number of inactive enterprises.

Taking into account the solvency index and data about share of enterprises in the regions with high, satisfactory and low solvency level, the attractiveness rating of regions was compiled by Credinform experts. As assessment factor were taken groups of the solvency index GLOBAS-I and total revenue of enterprises by each group in region.

Quite expectedly the first places of the rating take Moscow, Moscow Region and Saint-Petersburg. Despite the low percentage of companies with the highest solvency index, these regions have rather high proceeds of sales on each group of solvency levels. That’s why these regions take first place.

Table 1. Rating of regions by solvency of the companies
taking into account revenue and net profit
Rating of regions taking into account revenueRating of regions taking into account net profit
Place Region Place Region
1 Moscow 1 Tyumen Region
2 Moscow Region 2 Belgorod Region
3 Saint-Petersburg 3 Krasnoyarsk Territory
4 Novgorod region 4 Kemerovo region
5 Khanty-Mansi Autonomous Area 5 Saint-Petersburg
6 Krasnodar region 6 Komi Republic
7 Rostov region 7 Samara region
8 The Republic of Bashkortostan 8 Vologda Region
9 Sverdlovsk region 9 Irkutsk Region
10 Samara region 10 Orenburg Region
11 Novosibirsk region 11 Nizhny Novgorod Region
12 The Republic of Tatarstan (Tatarstan) 12 the Yamal-Nenets Autonomous Area
13 Chelyabinsk region 13 The Republic of Bashkortostan
14 Krasnoyarsk Territory 14 the Republic of Sakha (Yakutia)
15 Kemerovo region 15 Tver Region
______________________________________

1The solvency index of Globas-i® - independent assessment of creditworthiness and financial stability of legal entity, which was created by Credinform according to worldwide standards and considering specifics of Russian economy. Index value can be various: from 100 – the highest solvency level, to 600 – the highest credit risk or unsatisfactory solvency index.

However, if we replace the assessment factor on net profit, the distribution of regions will change drastically. In the rating of regions taking into account net profit the first three places take Tyumen, Belgorod Regions and Krasnoyarsk Territory. Saint-Petersburg is on the fifth place, Moscow - the last, with the maximum net loss. This fact can be explained by the existence in this region of many large companies, which losses, as a rule, are also high enough. The fact that Saint-Petersburg is in TOP-ratings, which are made of various factors, speaks about its high investment attractiveness and good business conditions. 

By similar technique Credinform experts defined leading industries taking into account revenue and net profit.

Table 2. TOP-5 of industries by solvency of the companies
taking into account revenue and net profit
Leader-industry by solvency of the companies
taking into account revenue
Leader-industry by solvency of the companies
taking into account net profit
Place Industry Place Industry
1 Wholesale and retail trade; repair of motor vehicles, motorcycles, household goods and goods for personal use  1 Production of fuel and energy minerals
2 Financial activity 2 Wholesale and retail trade; repair of motor vehicles, motorcycles, household goods and goods for personal use
3 Operations with real estate, rent and services 3 Production of coke, oil products and nuclear materials
4 Construction 4 Chemical production
5 Production of fuel and energy minerals 5 Mining and quarrying, except fuel and energy minerals

Wholesale and retail trade companies are the most competitive and attractive for investment, as taking into account revenue and net profit.

Information about current financial situation of the company you can get from daily updated database Globas-i®. Analytical reports on research of Russian economy industries and regions can be obtained by contacting our dedicated Customer Service Department.