
Order a report
Custom-made industry research, company ratings, competitor analysis


TOP-1000 companies in Rostov-on-Don
Development of the new scientific and industrial centers on the basis of the metropolitan areas has been one of the most popular topics of discussion recently. Continuing the cycle of publications about the largest cities of Russia, we offer a review of companies of one of the largest cities of the Russian South – Rostov-on-Don, where more than 79 thousand real economy enterprises work. Positive trends prevail in activities of the largest of them in the period from 2016 to 2020.
In particular, such trends as: increase of net assets, revenue and net profit. Among negative trends – increasing shares of companies with insufficient property, increase of average net loss values, decrease of return on investments and assets turnover.
Information agency Credinform selected the largest companies of the city (TOP-1000) in terms of annual revenue according to the data from the Statistical Register and the Federal Tax Service for the latest available accounting periods (2016 – 2020) for the analysis based on the data from the Information and Analytical system Globas.
Net assets are total assets less total liabilities. This indicator reflects the real value of the property of an enterprise. When the company’s debt exceeds the value of its property, the indicator is considered negative (insufficiency of property).
The largest company in term of net assets is LLC COMBINE FACTORY ROSTSELMASH, INN 6166048181, engaged in manufacture of machinery for harvesting. In 2020, net assets value of the enterprise amounted to more than 47 billion RUB.
The lowest net assets value among TOP-1000 was recorded for PALMALI CO. LTD., INN 6164087026, engaged in sea freight water transport. The legal entity is declared insolvent (bankrupt) and bankruptcy proceedings are initiated as of 21.11.2018. In 2020, insufficiency of property of the enterprise was indicated in negative value of -10,6 billion RUB.
During five-year period, the average net assets values of TOP-1000 have a trend to increase, with the decreasing growth rates (Picture 1).
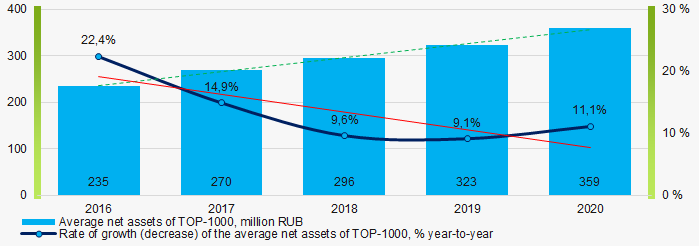 Picture 1. Change in average net assets value in TOP-1000 in 2016 - 2020
The shares of TOP-1000 companies with insufficient property had negative trend to increase during last 5 years (Picture 2).
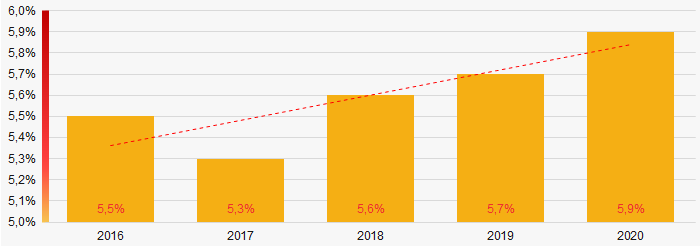 Picture 2. Shares of TOP-1000 companies with negative values of net assets in 2016 - 2020
Sales revenue
The revenue volume of TOP-10 companies amounted to 39% of the total revenue of TOP-1000 in 2020 (Picture 3). It gives evidence to a high level of the capital concentration among companies in Rostov-on-Don.
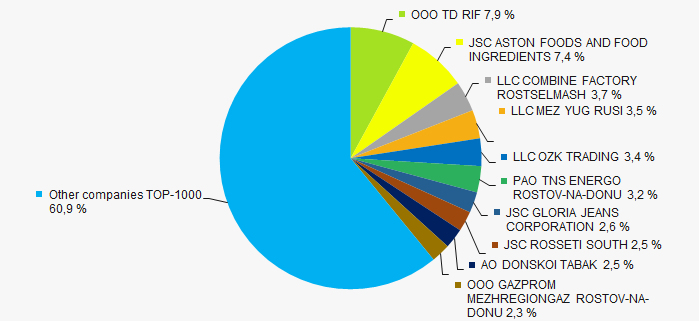 Picture 3. Shares of TOP-10 companies in the total revenue of TOP-1000 in 2020
In general, there is a trend to increase in revenue with increasing growth rates (Picture 4).
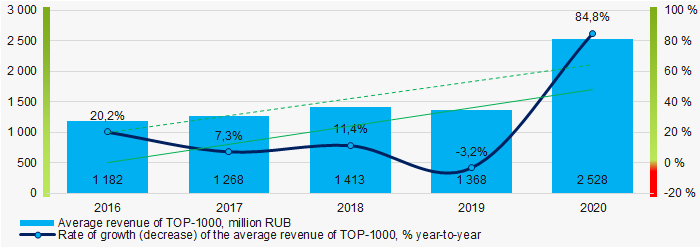 Picture 4. Change in average revenue of TOP-1000 companies in 2016– 2020
Profit and loss
The largest TOP-1000 company in term of net profit in 2020 is also LLC COMBINE FACTORY ROSTSELMASH. The company’s profit amounted to more than 11 billion RUB. During five-year period, the average profit figures and its growth rates of TOP-1000 companies have a trend to decrease with the increasing growth rates (Picture 5).
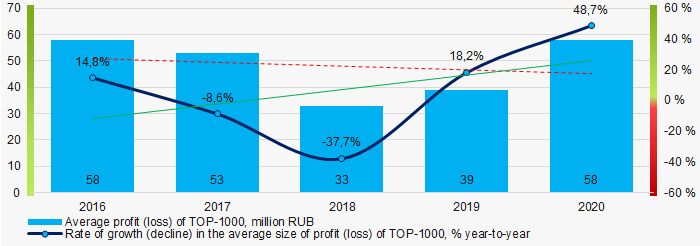 Picture 5. Change in average profit (loss) of TOP-1000 companies in 2016- 2020
During five-year period, the average net profit figures of TOP-1000 companies were not decreasing, whereas the average net loss was increasing. (Picture 6).
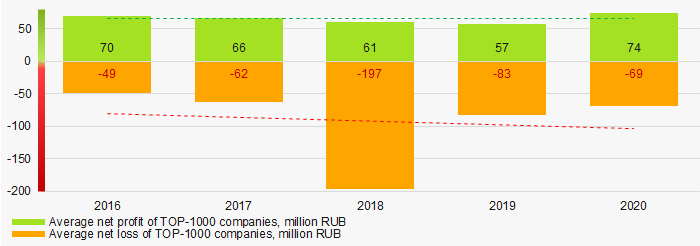 Picture 6. Change in average net profit and net loss of ТОP-1000 companies in 2016 – 2020
Key financial ratios
During five-year period, the average values of the current liquidity ratio of TOP-1000 companies were above the recommended one – from 1,0 to 2,0, with a trend to increase. (Picture 7).
Current liquidity ratio (current assets to short-term liabilities) shows the sufficiency of company’s assets to repay on short-term liabilities.
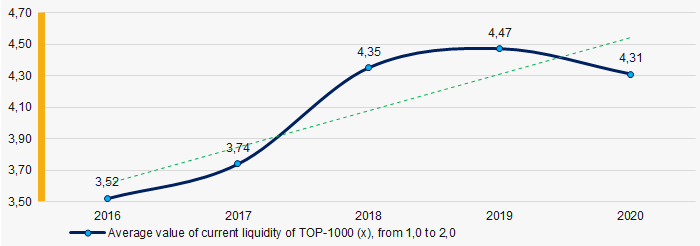 Picture 7. Change in average values of current liquidity ratio of TOP-1000 in 2016 – 2020
During five years, the average ROI values of TOP-1000 companies were relatively high, having a trend to decrease (Picture 8).
ROI ratio is calculated as net profit to sum of shareholders equity and long-term liabilities, and shows the return of equity involved in commercial activities and long-term borrowed funds.
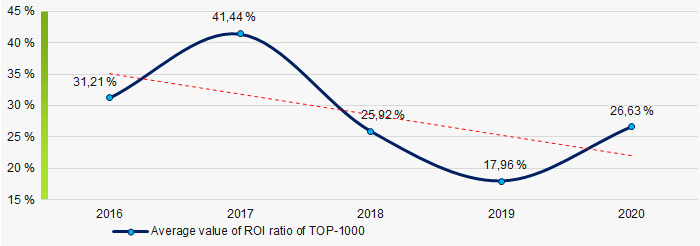 Picture 8. Change in average values of ROI ratio of TOP-1000 in 2016 – 2020
Assets turnover ratio is the ratio of sales revenue and company’s average total assets for a period. It characterizes the effectiveness of using of all available resources, regardless the source of their attraction. The ratio shows how many times per year the full cycle of production and circulation is performed, generating the corresponding effect in the form of profit.
During the five-year period, there was a trend to decrease of this ratio (Picture 9).
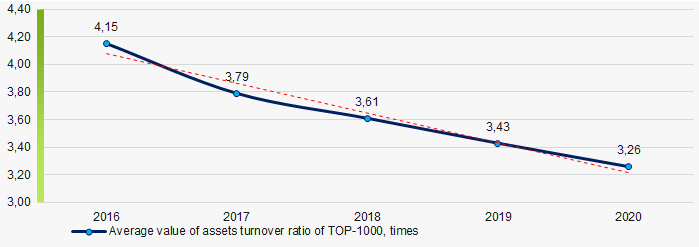 Picture 9. Change in average values of assets turnover ratio of TOP-1000 companies in 2016 – 2020
Small enterprises
78% companies of TOP-1000 are registered in the Register of small and medium-sized enterprises of the Federal Tax Service of the Russian Federation. However, their share in total revenue of TOP-1000 in 2020 amounts to 20,4%, which equals to an average country value in 2018 - 2019 (Picture 10).
 Picture 10. Shares of small and medium-sized enterprises in TOP-1000
Financial position score
According to the assessment, the financial position of most of TOP-1000 companies is above average (Picture 11).
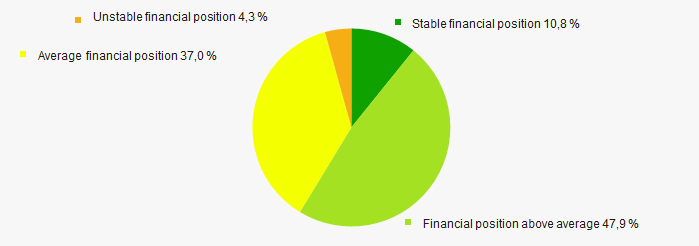 Picture 11. Distribution of TOP-1000 companies by financial position score
Solvency index Globas
Most of TOP-1000 companies got Superior / High and Strong / Medium index Globas. This fact shows their ability to meet their obligations fully and by the due date (Picture 12).
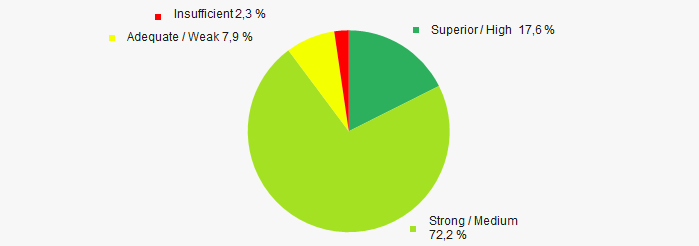 Picture 12. Distribution of TOP-1000 companies by solvency index Globas
Conclusion
Complex assessment of activity of the largest companies in Rostov-on-Don, taking into account the main indexes, financial ratios and indicators, demonstrates the prevalence of positive trends in their activity in 2016 – 2020 (Table 1).
| Trends and evaluation factors | Relative share of factor, % |
| Dynamics of the average net assets value | |
| Rate of growth (decline) in the average size of net assets | |
| Increase / decrease in the share of enterprises with negative values of net assets | |
| Level of capital concentration (monopolization) | |
| Dynamics of the average revenue | |
| Rate of growth (decline) in the average size of revenue | |
| Dynamics of the average profit (loss) | |
| Rate of growth (decline) in the average size of profit (loss) | |
| Growth / decline in average values of net profit | |
| Growth / decline in average values of net loss | |
| Increase / decrease in average values of current liquidity ratio | |
| Increase / decrease in average values of return on investment ratio | |
| Increase / decrease in average values of asset turnover ratio, times | |
| Share of small and medium-sized businesses in terms of revenue being more than 20% | |
| Financial position (the largest share) | |
| Solvency index Globas (the largest share) | |
| Average value of relative share of factors | |
![]() positive trend (factor),
positive trend (factor), ![]() negative trend (factor)
negative trend (factor)