
Order a report
Custom-made industry research, company ratings, competitor analysis


TOP-10 companies engaged in extraction of non-ferrous metal ores
Information agency Credinform represents a ranking of the largest Russian companies engaged in extraction of non-ferrous metal ores. Companies with the largest volume of annual revenue (TOP-10 and TOP-100) were selected for the ranking, according to the data from the Statistical Register and the Federal Tax Service for the latest available periods (2017 - 2019). They were ranked by asset coverage ratio (Table 1). The selection and analysis of companies were based on the data of the Information and Analytical system Globas.
Asset coverage ratio(x) is calculated as the difference between equity and non-current assets to current assets.
The ratio shows the ability of an enterprise to finance current activities only with its working capital. The recommended value is > 0.1.
For the most complete and objective view of the financial condition of the enterprise, it is necessary to pay attention to the complex of indicators and financial ratios of the company.
| Name, INN, region | Revenue, million RUB | Net profit (loss), million RUB | Asset coverage ratio (x), > 0,1 | Solvency index Globas | |||
| 2018 | 2019 | 2018 | 2019 | 2018 | 2019 | ||
| 1 | 2 | 3 | 4 | 5 | 6 | 7 | 8 |
| JSC SEREBRO MAGADANA INN 4900003918 Magadan region |
24 733 | |
11 094 | |
0,80 | |
284 Medium |
| CHUKOTKA MINING AND GEOLOGICAL COMPANY INN 8709009294 Chukotka autonomous region |
30 436 | |
9 812 | |
0,62 | |
305 Adequate |
| JSC POLYUS MAGADAN INN 4906000960 Magadan region |
7 191 | |
-2 127 | |
0,19 | |
292 Medium |
| JSC BOKSIT TAMANA INN 1117000011 The Republic of Komi |
217 Strong | ||||||
| LLC MEDVEZHIY RUCHEY INN 2457080792 Krasnoyarsk territory |
25 681 | |
5 897 | |
0,28 | |
298 Medium |
| LLC NERYUNGRI-METALLIK INN 1434024359 The Republic of Sakha (Yakutia) |
9 278 | |
3 970 | |
-3,03 | |
275 Medium |
| LLC GRK BYSTRINSKOE INN 7701568891 Zabaikalye territory |
261 Medium | ||||||
| MIKHEEVSKY MINING AND PROCESSING PLANT INN 7428007317 Chelyabinsk region |
202 Strong | ||||||
| GAISKY MINING AND PROCESSING PLANT INN 5604000700 Orenburg region |
252 Medium | ||||||
| JSC POLYUS KRASNOYARSK INN 2434000335 Krasnoyarsk territory |
135 881 | |
34 843 | |
-4,10 | |
274 Medium |
| Average value for TOP-10 | |
|
|
|
|
|
|
| Average value for TOP-1000 | |
|
|
|
|
|
|
![]() growth of indicator to the previous period,
growth of indicator to the previous period, ![]() decrease of indicator to the previous period,
decrease of indicator to the previous period, ![]() colorless – no data for 2017
colorless – no data for 2017
The average indicator of the asset coverage ratio of TOP-10 has negative value and is above the average one of TOP-1000. In 2019, five companies have values above the recommended one. Eight companies increased the value compared to the previous period.
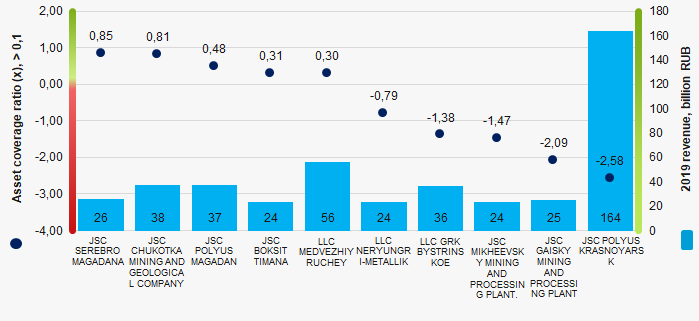 Picture 1. Asset coverage ratio and revenue of the largest Russian companies engaged in extraction of non-ferrous metal ores (TOP-10)
 During six years, the average values of the asset coverage ratio of TOP-1000 were negative with a trend to decrease (Picture 2).
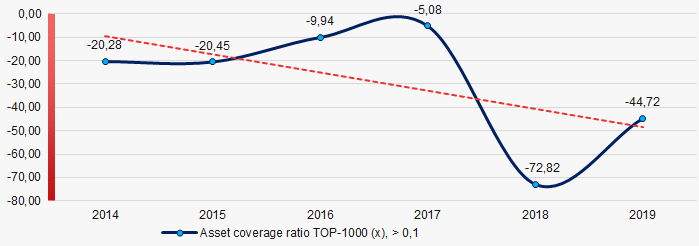 Picture 2. Change in the average values of the asset coverage ratio of the TOP-50 largest Russian companies engaged in extraction of non-ferrous metal ores in 2014 - 2019