
Order a report
Custom-made industry research, company ratings, competitor analysis


Russia regains position in the foreign trade
In 2017, Russia exported goods and services at the total value of 353 bln US dollars that is 25% higher than the previous year. Despite the significant increase, the country’s share in global export does not exceed 2%.
Strategically, export is a tool for activation of existing and potential competitive edge of any economy in the international differentiation of labor.
Maximum amount of the Russian export was recorded in 2012 — 527 bln US dollars (see Picture 1). However, following the results of 2016, after the imposing sanctions and rouble devaluation, export decreased almost two times — to 282 bln US dollars. At the positive trend of increasing export in January-February 2018 by 26% to the level of 2017, growth up to 445 bln US dollars should be expected, and Russia will be included in Top-10 exporters again.
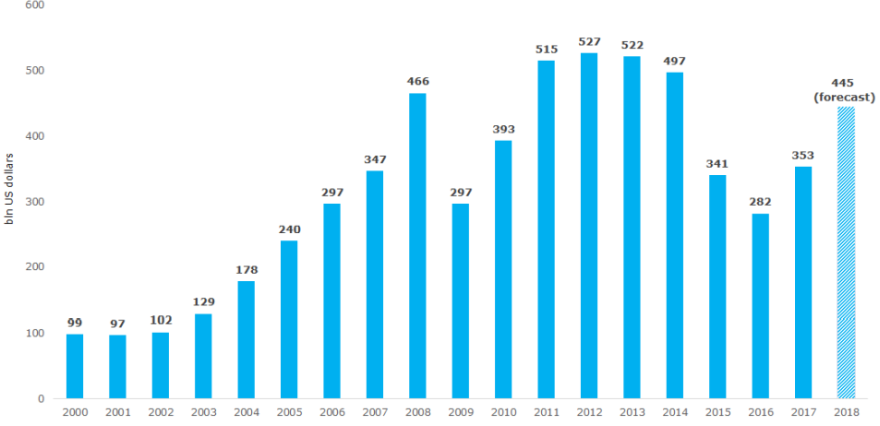 Picture 1. Dynamics of the Russian export by balance of payments methodology, bln US dollars
Analyzing the Russian export, a set of features could be noted:
1. Small share in the global differentiation of labor
The share of Russia in the global differentiation of labor remains to be low. Having scientific, technological and human resources, the country is only the 13th by the amount of goods and services delivery to the global market, which in general corresponds to its current economic development: relation of export to the GDP is 22,4% that is close to the worldwide average (see Table 1). By total exports, Russia takes a back seat to Singapore, Mexico and Canada.
China continues to top the rating. Total exports of the country for 2017 amounted to 2 698 bln US dollars that is 15,6% of global figure. The USA and Germany are the 2nd and 3rd respectively. However despite the high export volume of the USA, the monetary relation to the GDP is low — 8,1%, while in Germany it is 38%. So in relative terms the export potential of Germany is 4,8 times higher than the USA, and the export potential of Russia is 2,8 times higher than American.
| Rank | Country | Volume of goods and services export in 2017, bln US dollars | Share in global export, % | Export to nominal GDP, % |
| 1 | China (incl. Hong Kong and Macao, excl. Taiwan) |
2 698 | 15,6 | 21,7 |
| 2 | USA | 1 576 | 9,1 | 8,1 |
| 3 | Germany | 1 401 | 8,1 | 38,0 |
| 4 | Japan | 683 | 3,9 | 14,0 |
| 5 | South Korea | 552 | 3,2 | 35,9 |
| 6 | France | 541 | 3,1 | 20,9 |
| 7 | Netherlands | 526 | 3,0 | 63,7 |
| 8 | Italy | 499 | 2,9 | 25,7 |
| 9 | Great Britain | 437 | 2,5 | 16,6 |
| 10 | Canada | 433 | 2,5 | 26,2 |
| 11 | Mexico | 407 | 2,4 | 35,4 |
| 12 | Singapore | 396 | 2,3 | 122,2 |
| 13 | Russia | 353 | 2,0 | 22,4 |
| 14 | Taiwan | 345 | 2,0 | 59,6 |
| 15 | Switzerland | 337 | 1,9 | 49,6 |
| 16 | UAE | 315 | 1,8 | 83,6 |
| 17 | Belgium | 309 | 1,8 | 62,4 |
| 18 | Spain | 302 | 1,7 | 23,0 |
| 19 | India | 299 | 1,7 | 11,5 |
| 20 | Saudi Arabia | 231 | 1,3 | 33,8 |
| Top-20 | 12 640 | 73,0 | 20,6 | |
| All countries | 17 310 | 100 | 21,7 | |
2. Misbalance in export structure
Following the results of 2013, 70% of the Russian export was accounted for mineral fuel, oil and gas. In 2017 the share of these products fell to 59%, but still exceeds the share of all other goods in the total export volume.
3. Dependence of export on countries conducting policy of sanctions pressure and political confrontation
Top-10 of countries importing goods and services from Russia includes among other countries which conduct hostile sanctions policy of domestic companies and chief senior executives: the USA (6th position), Japan (7th) and Ukraine (8th).
However the main export direction of Russia is EU countries — 44,6% of total volume in monetary terms (see Table 2). Interrelationship of Russia and the EU in trade slightly reduce political risks and possibility of deeper confrontation happens to be nowadays.
| Rank | Country, economic union | Export volume, RF, bln US dollars | Share in total export, % |
| 1 | EU | 159,7 | 44,6 |
| 2 | China | 38,9 | 10,9 |
| 3 | EAEU | 33,7 | 9,4 |
| 4 | Turkey | 18,7 | 5,2 |
| 5 | South Korea | 12,3 | 3,4 |
| 6 | USA | 10,6 | 3,0 |
| 7 | Japan | 10,4 | 2,9 |
| 8 | Ukraine | 7,9 | 2,2 |
| 9 | India | 6,4 | 1,8 |
| 10 | Egypt | 6,2 | 1,7 |
| Top-10 | 304,8 | 86,4 | |
4. Predominance of the US dollar at settle for goods and services supplies
Dollar continues to be the leading currency at settlement structure of domestic counterparties for goods and services supplies by foreign trade contracts. Its share in 2017 was 69%, while 15% accounts for Euro, 15% — for Russian Rouble and 2% — for other currencies. Comparing to 2013, Dollar’s share demonstrated an 11% reduction, when Euro and Rouble increased by 6% and 5% respectively.
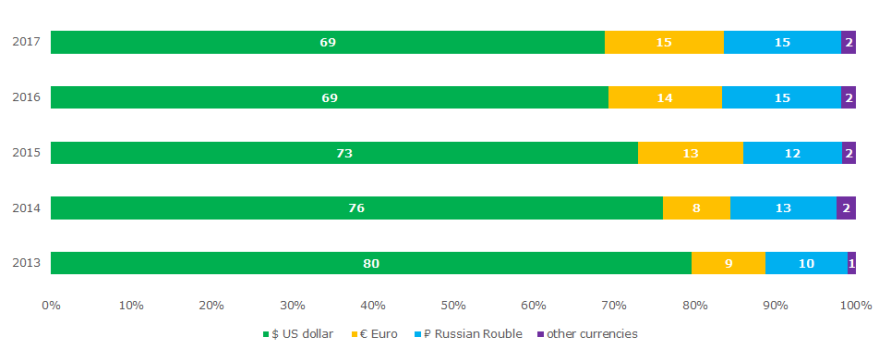 Picture 2. Currency structure of settlement for supplies of the Russian goods and rendering of services by foreign trade contracts, dynamics
Exporting goods and services, the country is directly involved in international trade. Export revenues provide budget replenishment and administer funds for industry development, support of economy, social payments.
Companies supplying the export markets (without compromising the domestic one) will always be in constant search of new technologies, ways to improve efficiency, development of logistics and management. Expansion into new markets allows to increase revenues, raise wages, expand the staff, affecting the inland level of prosperity by doing so.
Marketability shows success of both a particular company and the country in general. Increasing the share in foreign trade, Russia could avoid dangerous confrontation with the Occident.
In the words of Benjamin Constant, politician and writer of the age of the French Revolution, "... War is all impulse, commerce is calculation. Hence it follows that an age must come in which commerce replaces war. We have reached this age".