
Order a report
Custom-made industry research, company ratings, competitor analysis


Trends in the activity of companies in the sphere of packaging production
Information agency Credinform represents an overview of trends in the activity of companies in the sphere of packaging production.
Enterprises with the largest volume of annual revenue engaged in the sphere of packaging production (TOP-10 and TOP-1000), were selected for the analysis, according to the data from the Statistical Register for the latest available periods (for 2014, 2015, 2016). The analysis was made on the basis of the data of the Information and Analytical system Globas.
Net assets
The indicator, reflecting the real value of company's property, is calculated annually as the difference between assets on the enterprise balance and its debt obligations. The indicator of net assets is considered negative (insufficiency of property), if company’s debt exceeds the value of its property.
| № in TOP-1000 | Name, INN, region | Net assets value, mln RUB.* | Solvency index Globas | ||
| 2014 | 2015 | 2016 | |||
| 1 | 2 | 3 | 4 | 5 | 6 |
| 1. | CJS National Enterprise Naberezhnochelninsky paperboard plant S.P.Titov INN 1650017638 Republic of Tatarstan |
5 460 | 6 458 | 7 400 | 148 Superior |
| 2. | JSC TETRA PAK INN 7706017070 Moscow |
3 082 | 4 931 | 6 784 | 177 High |
| 3. | STORA ENSO PACKAGING BB LLC INN 4003014954 Kaluga region |
2 330 | 3 233 | 4 649 | 148 Superior |
| 4. | Alpla LLC INN 5056000026 Moscow region |
1 921 | 2 707 | 3 813 | 136 Superior |
| 5. | ARKHBUM NJSC INN 2903003430 Arkhangelsk region |
2 088 | 2 608 | 3 425 | 176 High |
| 996. | FIRST FOLDING CARTON PLANT LIMITED INN 3902069327 Kaliningrad region |
-192 | -243 | -319 | 366 Adequate |
| 997. | POLIPAK LLC INN 2632058496 Stavropol territory |
-256 | -452 | -341 | 260 Medium |
| 998. | KONDROVO PAPER COMPANY PJSC INN 4004001796 Kaluga region Process of being wound up, 29.03.2017 |
-468 | -569 | -603 | 600 Insufficient |
| 999. | RUSSKII VINO-VODOCHNYI TREST NJSC INN 7703369034 Moscow Process of being wound up, 02.11.2016 |
1 273 | 1 278 | -2 163 | 600 Insufficient |
| 1000. | MULTIFLEX NJSC INN 7711040733 Moscow |
-1 277 | -2 757 | -5 142 | 320 Adequate |
*) – the indicators of growth or decline to the previous period are marked in columns 4 and 5 with green and red fillings, respectively.
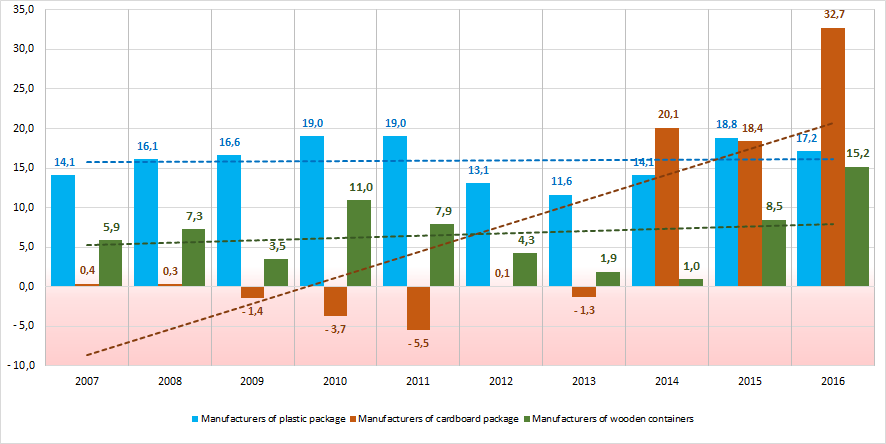 Picture 1. Change in the industry average indicators of the net asset value of companies in the sphere of packaging production in 2007 – 2016
Sales revenue
The revenue of 10 industry leaders made 29% of the total revenue of TOP-1000 companies in 2016. It points to a relatively high level of competition in the industry (Picture 2).
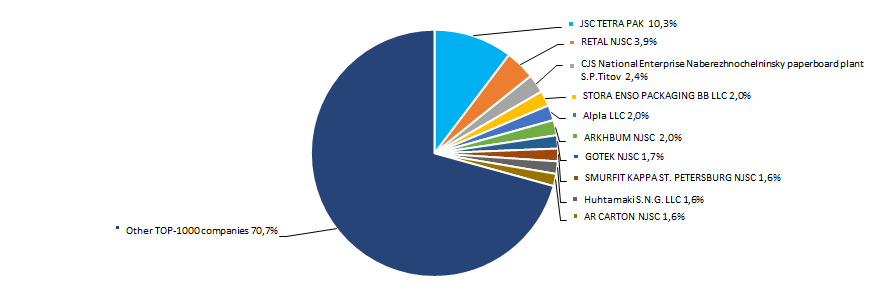 Picture 2. Shares of participation of TOP-10 companies in the total revenue of TOP-1000 companies for 2016
In general, there is a trend towards an increase in volume revenue among manufacturers of cardboard package (Picture 3).
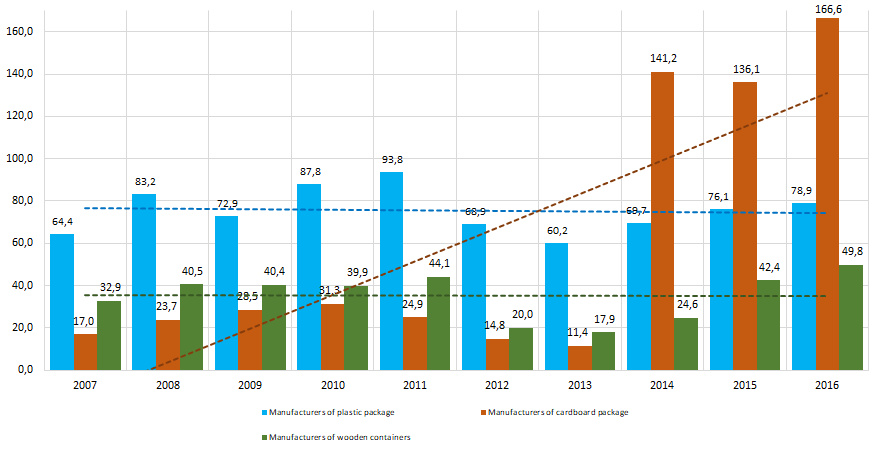 Picture 3. Change in the industry average revenue of companies in the sphere of packaging production in 2007 – 2016
Profit and losses
The profit volume of 10 industry leaders in 2016 made 51% of the total profit of TOP-1000 companies (Picture 4).
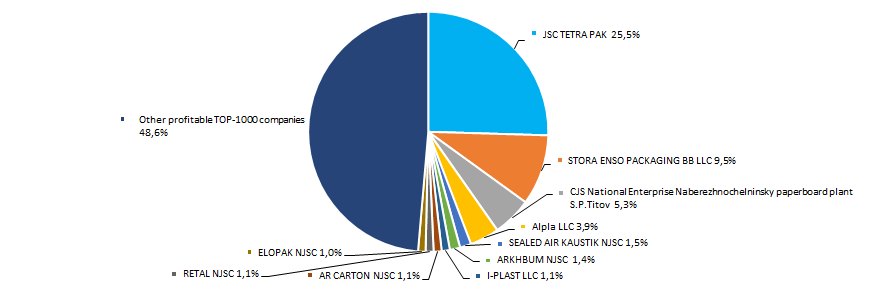 Picture 4. Share of participation of TOP-10 companies in the total volume of profit of TOP-1000 companies for 2016
Industry average profit’s indicators of manufacturers of cardboard package and wooden containers or the ten-year period trend to increase (Picture 5).
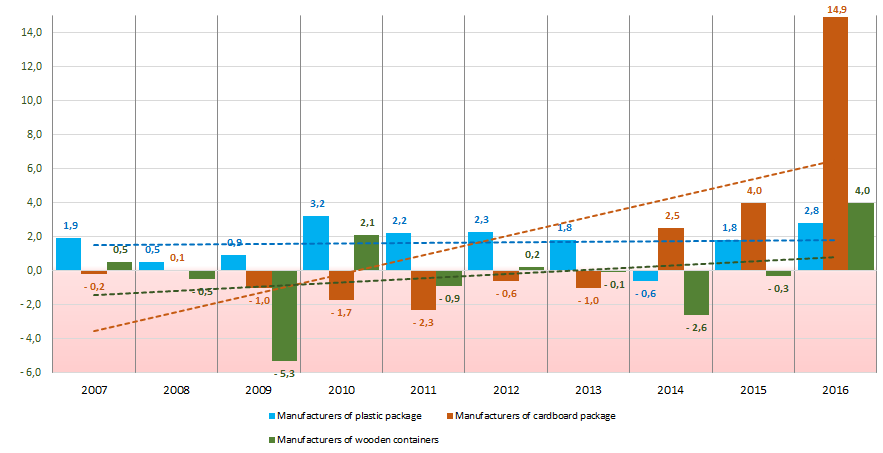 Picture 5. Change in the industry average indicators of profit of companies in the sphere of packaging production in 2007 – 2016
Over a three-year period, the average values of profit indicators of TOP-1000 companies tends to increase. The average value of net loss also increases (Picture 6).
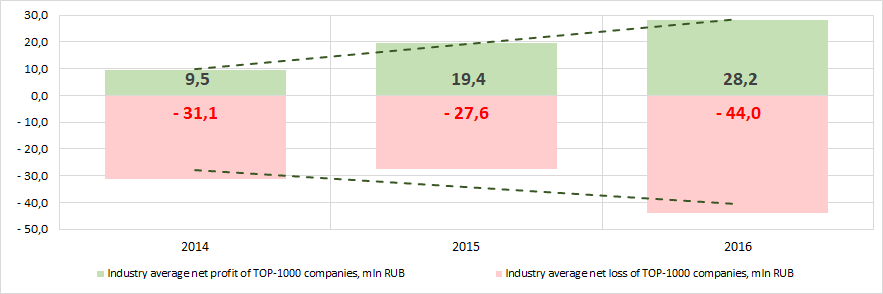 Picture 6. Change in the industry average indicators of profit and loss of the largest companies in the sphere of packaging production 2014 – 2016
Key financial ratios
Over the ten-year period the industry average indicators of the total liquidity ratio were in the range of recommended values – from 1,0 up to 2,0 (Picture 7). In general, the ratio indicator tends to increase.
The total liquidity ratio (the relation of the amount of current assets to short-term liabilities) shows the sufficiency of company’s funds for repayment of its short-term liabilities.
The experts of the Information agency Credinform, taking into account the actual situation both in the economy as a whole and in the sectors, has developed and implemented in the Information and Analytical system Globas the calculation of practical values of financial ratios that can be recognized as normal for a particular industry. For companies in the sphere of packaging production the practical value of the total liquidity ratio made from 1,02 up to 3,00 in 2016.
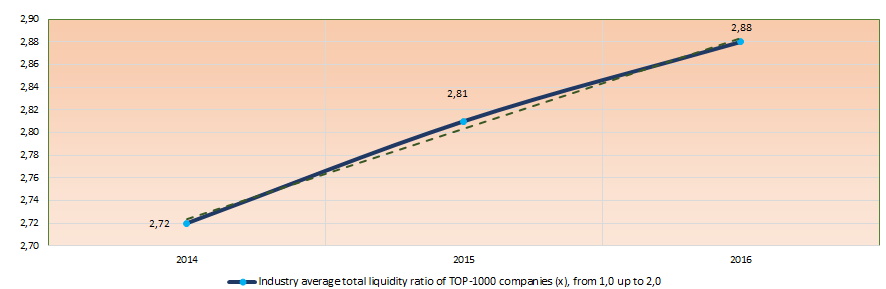 Picture 7. Change in the average industry values of the total liquidity ratio of companies in the sphere of packaging production 2014 – 2016
There has been a decline in indicators of the return on investment ratio (Picture 8) for three years. The ratio is calculated as the relation of net profit to the sum of own capital and long-term liabilities and demonstrates the return on the equity involved in the commercial activity of own capital and the long-term borrowed funds of an organization.
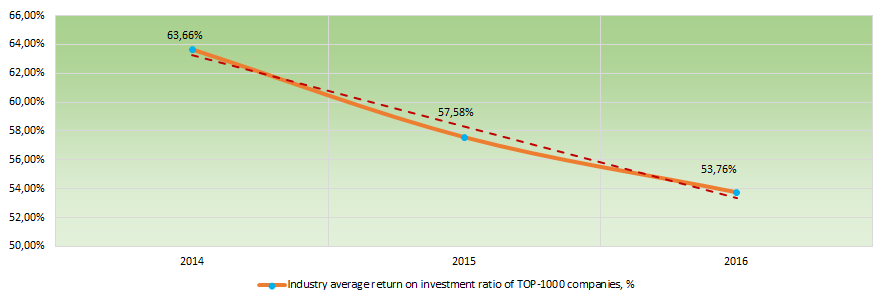 Picture 8. Change in the average industry values of the return on investment ratio of companies in the sphere of packaging production 2014 – 2016
Asset turnover ratio is calculated as the relation of sales proceeds to the average value of total assets for a period and characterizes the efficiency of use of all available resources, regardless of the sources of their attraction. The ratio shows how many times a year a complete cycle of production and circulation is made, yielding profit.
This business activity ratio showed a tendency to increase for three-year period (Picture 9).
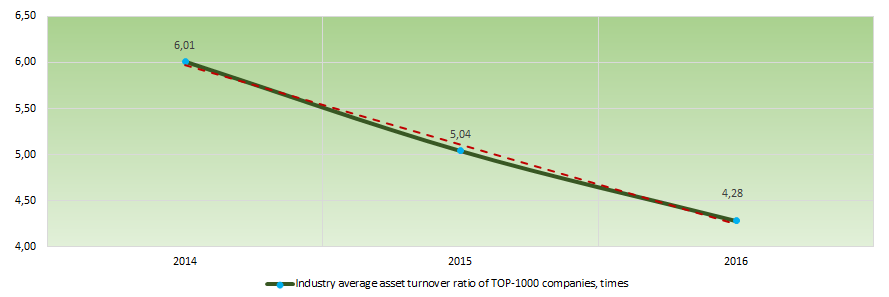 Picture 9. Change in the average industry values of the asset turnover ratio of companies in the sphere of packaging production 2014 – 2016
Production structure
The largest share in the total revenue of TOP-1000 is owned by companies, specializing in the manufacture of plastic products for packaging of goods (Picture 10).
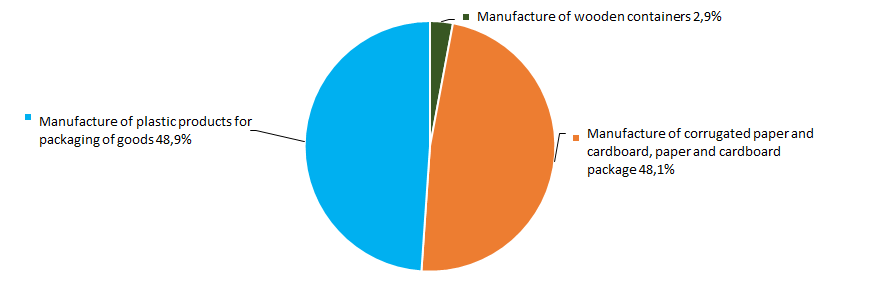 Picture 10. Distribution of companies by types of output in the total revenue of TOP-1000 enterprises, %
Main regions of activity
TOP-1000 companies are unequally distributed across the Russian territory and registered in 70 regions (Picture 11).
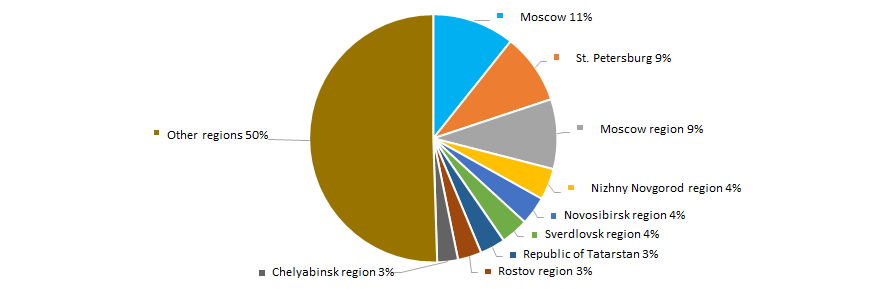 Picture 11. Distribution of TOP-1000 companies by regions of Russia
Financial position score
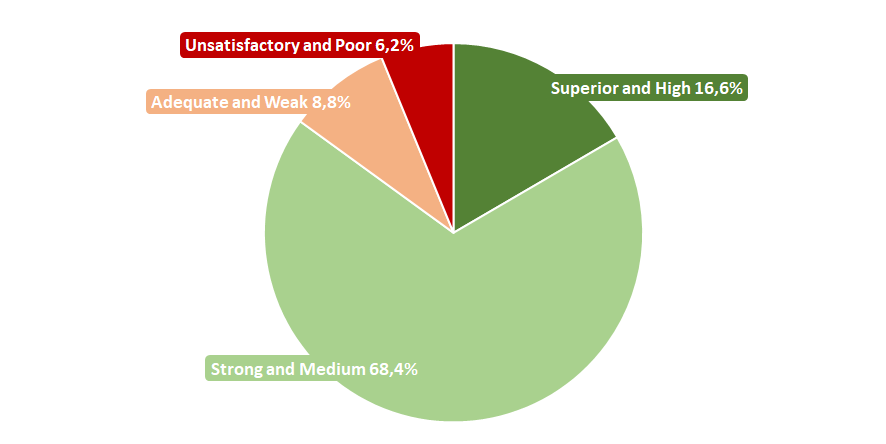
An assessment of the financial position of companies in the industry shows that the largest number is in a stable financial position and above the average (Picture 12).
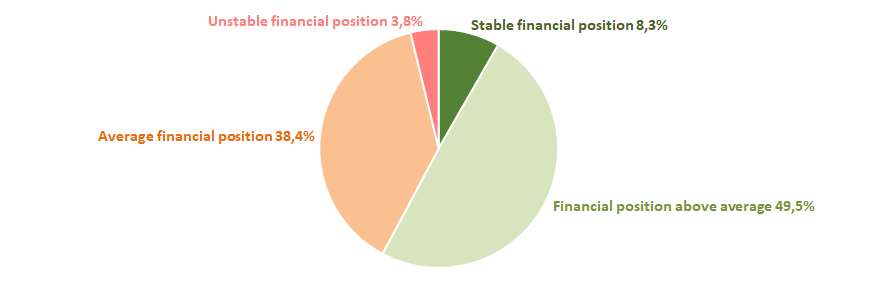 Picture 12. Distribution of TOP-1000 companies by financial position score
Solvency index Globas
Most of TOP-1000 companies got Superior/High or Medium Solvency index Globas, that points to their ability to repay their debts in time and fully (Picture 13).
 Picture 13. Distribution of TOP-1000 companies by solvency index Globas
Thus, a comprehensive assessment of the activity of companies in the sphere of packaging production, taking into account the main indices, financial indicators and ratios, points to the presence of multidirectional trends, depending on the specialization of production. In general, relative stability is observed in the industry.