
Order a report
Custom-made industry research, company ratings, competitor analysis


Trends in consumer goods trade
Information agency Credinform represents a ranking of the largest Russian non-grocery goods wholesalers. The largest distributors of garments, footwear, household appliances, pharmaceutical and other goods with the highest annual revenue (TOP-1000) were selected for the ranking, according to the data from the Statistical Register and the Federal Tax Service for the latest available periods (2014 - 2019). The selection and analysis of companies were based on the data of the Information and Analytical system Globas.
Net assets are total assets less total liabilities. This indicator reflects the real value of the property of an enterprise. When the company’s debt exceeds the value of its property, the indicator is considered negative (insufficiency of property).
The largest company in term of net assets is OTCPHARM JSC, INN 5047149534, Moscow, wholesale of pharmaceuticals. In 2019, net assets value of the company exceeded 58 billion RUB.
The lowest net assets value among TOP-1000 belonged to LLC TK RUS-STEKLO, INN 5047105505, Moscow region, wholesale of ceramics and glass items. The company is in insolvency and under supervision since 08.03.2021. In 2019, insufficiency of property of the legal entity was indicated in negative value of -1,8 billion RUB.
Covering the ten-year period, the average net assets values of TOP-100 have a trend to increase with an increasing growth rate (Picture 1).
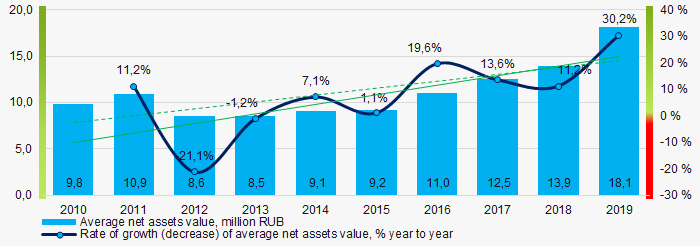 Picture 1. Change in industry average net assets value in 2010 – 2019
Over the past six years, the share of companies with insufficient property had a positive trend to decrease (Picture 2).
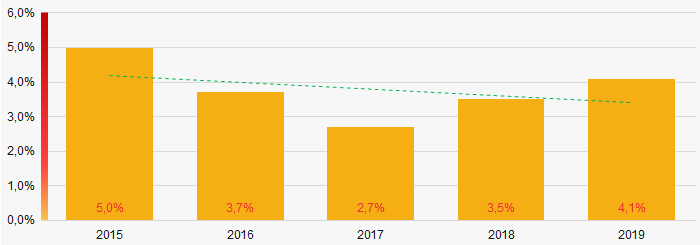 Picture 2. Shares of TOP-1000 companies with negative net assets value in 2015-2019
Sales revenue
In 2019, the revenue volume of ten largest companies was 25% of total TOP-1000 revenue (Picture 3). This is indicative of a relatively high competition in the non-grocery goods wholesale market.
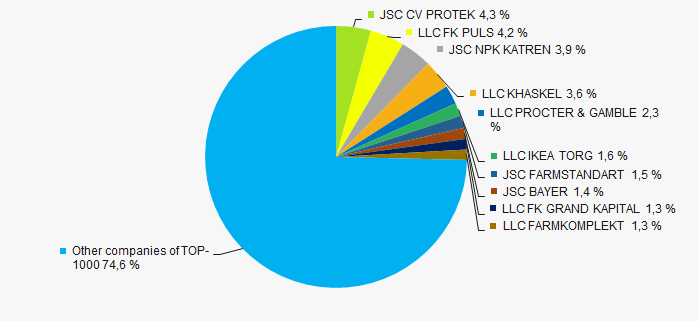 Picture 3. The share of TOP-10 companies in total 2019 revenue of TOP-1000
In general, there is a trend to increase in revenue (Picture 4).
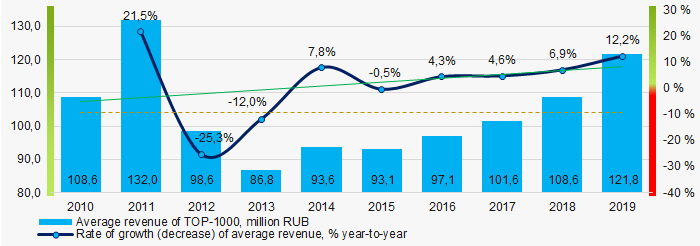 Picture 4. Change in industry average net profit in 2010 – 2019
Profit and loss
The largest organization in term of net profit is JSC FARMSTANDART, INN 0274110679, Moscow region, wholesale of pharmaceuticals. The company’s profit for 2019 was near 12 billion RUB.
Covering the ten-year period, there is a trend to decrease in average net profit with the decreasing growth rate (Picture 5).
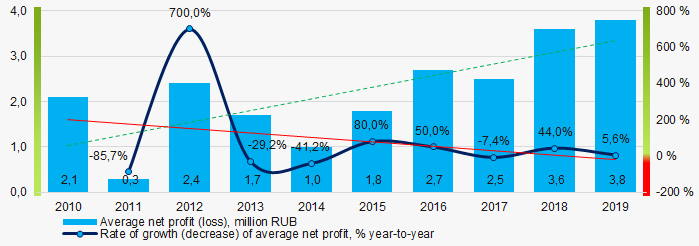 Picture 5. Change in industry average net profit (loss) values in 2010 – 2019
For the five-year period, the average net profit values of TOP-1000 have the increasing trend with the decreasing net loss (Picture 6).
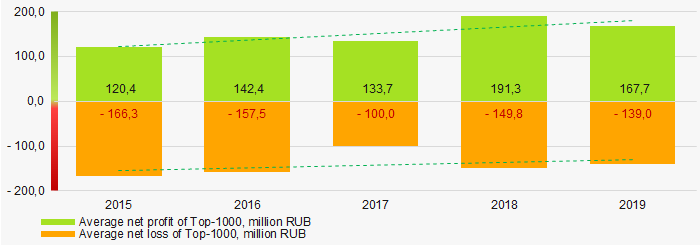 Picture 6. Change in average net profit and net loss of ТОP-1000 in 2015 – 2019
Key financial ratios
Covering the ten-year period, the average values of the current liquidity ratio were within the recommended one - from 1,0 to 2,0 with a trend to increase (Picture 7).
Current liquidity ratio (current assets to short-term liabilities) shows the sufficiency of company’s assets to repay on short-term liabilities.
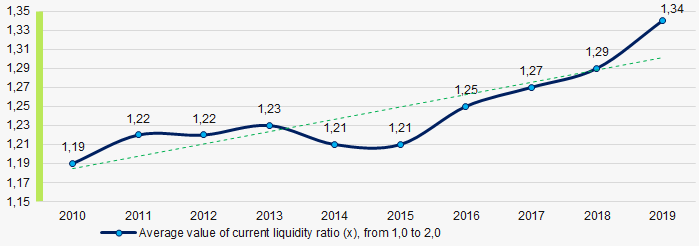 Picture 7. Change in industry average values of current liquidity ratio in 2010 – 2019
Covering the ten-year period, the average values of ROI ratio had a trend to increase (Picture 8).
ROI ratio is calculated as net profit to sum of shareholders equity and long-term liabilities, and shows the return of equity involved in commercial activities and long-term borrowed funds.
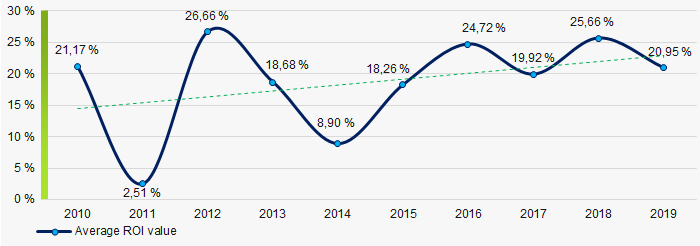 Picture 8. Change in industry average values of ROI ratio in 2010 – 2019
Assets turnover ratio is the ratio of sales revenue and company’s average total assets for a period. It characterizes the effectiveness of using of all available resources, regardless the source of their attraction. The ratio shows how many times per year the full cycle of production and circulation is performed, generating the corresponding effect in the form of profit.
Covering the ten-year period, business activity ratio demonstrated the decreasing trend (Picture 9).
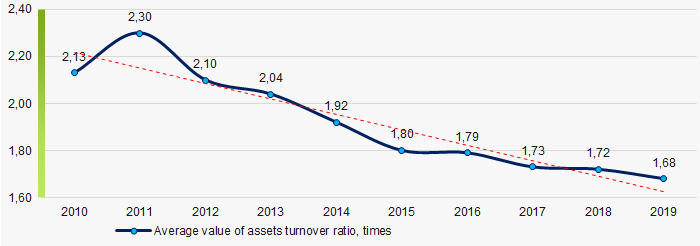 Picture 9. Change in average values of assets turnover ratio in 2010 – 2019
Small business
48% of companies included in TOP-1000 are registered in the Register of small and medium-sized enterprises of the Federal Tax Service of the Russian Federation. In 2019, their share in total revenue of TOP-1000 was 10,3%, lower than the average country values (Picture 10).
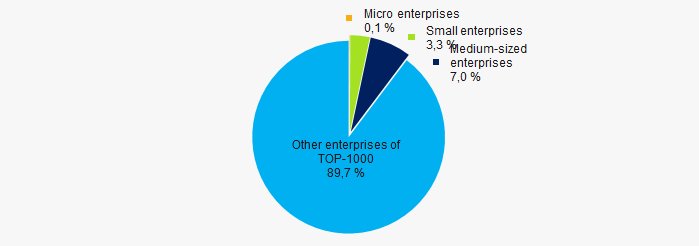 Picture 10. Shares of small and medium-sized enterprises in TOP-1000
Main regions of activity
Companies of TOP-1000 are registered in 61 regions of Russia, and unequally located across the country. Near 71% of companies largest by revenue are located in Moscow and Moscow region (Picture 11).
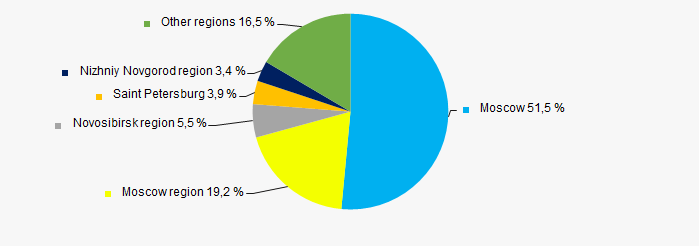 Picture 11. Distribution of TOP-1000 revenue by regions of Russia
Financial position score
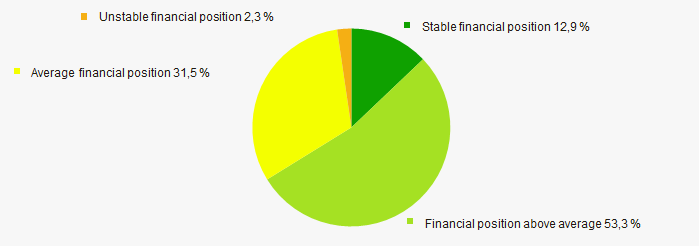
Assessment of the financial position of TOP-1000 companies shows that the majority of them have financial position above average (Picture 11).
 Picture 12. Distribution of TOP-100 companies by financial position score
Solvency index Globas
Most of TOP-1000 companies got Superior / High and Strong / Medium indexes Globas. This fact shows their limited ability to meet their obligations fully (Picture 13).
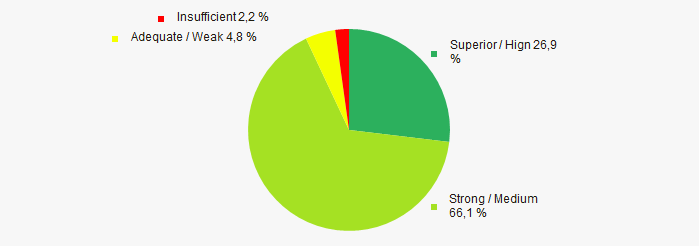 Picture 13. Distribution of TOP-1000 companies by solvency index Globas
Conclusion
Complex assessment of activity of the non-grocery trade wholesalers, taking into account the main indexes, financial ratios and indicators, demonstrates the prevalence of negative trends in 2010 - 2019 (Table 1).
| Trends and evaluation factors | Relative share of factors, % |
| Dynamics of the average net assets value | |
| Rate of growth (decrease) in the average size of net assets | |
| Increase (decrease) in the share of enterprises with negative values of net assets | |
| Level of competition / monopolization | |
| Dynamics of the average revenue | |
| Rate of growth (decrease) in the average size of revenue | |
| Dynamics of the average profit (loss) | |
| Rate of growth (decrease) in the average profit (loss) | |
| Growth / decline in average values of companies’ net profit | |
| Growth / decline in average values of companies’ net loss | |
| Increase / decrease in average values of total liquidity ratio | |
| Increase / decrease in average values of return on investment ratio | |
| Increase / decrease in average values of asset turnover ratio, times | |
| Share of small and medium-sized businesses in terms of revenue being more than 20% | |
| Regional concentration | |
| Financial position (the largest share) | |
| Solvency index Globas (the largest share) | |
| Average value of relative share of factors | |
![]() positive trend (factor),
positive trend (factor), ![]() negative trend (factor)
negative trend (factor)