Data about tax arrears are published in the Globas system
On December, 1 2018 the Federal Tax Service (FTS) has disclosed publicly available data about debts of legal entities on taxes and fees and information about tax evasion.
Data about amounts of arrears, late fees, penalties: 1,5 mln companies.
Data about tax evasion: 370 th companies.
Data are referred to penalties and arrears that were formed till December 31, 2017 and not paid up till October 1, 2018.
Information that was earlier classified as tax secret is now available in the Globas system in the «Taxes and fees» section of the company report, where can be found data about special tax regime, participation of organizations in the consolidated group of taxpayers, paid amounts of taxes and fees.
Earlier the FTS has also disclosed information about average number of employees of legal entities, amounts of incomes and expenditure of companies according to the data from the financial accounts for 2017. Data are displayed in the section «Key financial and economic indicators» of the Globas system.
Arrears amounts, fees and insurance penalties for the first time will be published by the FTS in 2019.
With the help of new information users of the Globas system can manage counterparty risks with dishonest taxpayers.
It should be reminded that data are published regarding Russian legal entities, except for strategic enterprises, military industrial sector companies and the largest taxpayers.
Russia is first in Europe by the industrial production volume
Development of countries in the post-industrial period leads to paradoxical results: countries with up-to-date export-oriented manufacturing will benefit in the long view. Russia is among them.
Nominal GDP volume – the market price of all produced goods and rendered services over a year – is one of the key figures in international comparison of economic development of countries and territories.
Nowadays, services sector is prevalent in modern economies. The majority of countries have embraced the post-industrial period. However, we still in need of houses, electric power and manufactured goods.
GDP calculated using the purchasing power parity (PPP) reflects more objectively the achievements of various countries. Data on contribution of manufacturing to GDP makes it possible to compare countries, assess their significance and share in global industrial production.
Speaking about the figures, China reasonably has status of “the world’s factory”. Following the results of 2017, over 24% of total industrial production at the amount of 9 167 billion USD at PPP fell for its share. Production makes 39,5% of GDP in China (see Table 1).
Considered as the industrial leader over the last century, now the USA yields the palm: the country produces goods at the amount of 3 683 billion USD or 9,7% of global production, that is 2,5 times less than in China. The United States is trapped with globalization: at the time, American companies have transferred operations to China. This was resulted in huge negative trade balance, which forms particularly due to the trade with China. The country has to import on a massive scale. In this regard, it could well be understood in attempts to remedy the situation by introducing protective duties to reduce dependence on imports.
Being ahead of Germany, Russia is the first in Europe and sixth in the world by industrial production. Our country has developed fuel and energy complex, as well as advanced developments and orders in nuclear power, military-industrial complex, metallurgy, and chemical industry. By the trade surplus volume (when export exceeds import) in absolute monetary terms, Russia ranks third after China and Germany.
| Position | Country | Industrial output volume at PPP, billion USD | Share of manufacturing in GDP, % | Share in global industrial output volume, % | GDP at PPP, billion USD |
| 1 | China | 9 167 | 39,5 | 24,2 | 23 208 |
| 2 | USA | 3 683 | 18,9 | 9,7 | 19 485 |
| 3 | India | 2 179 | 23,0 | 5,8 | 9 474 |
| 4 | Japan | 1 616 | 29,7 | 4,3 | 5 443 |
| 5 | Indonesia | 1 310 | 40,3 | 3,5 | 3 250 |
| 6 | Russia | 1 301 | 32,4 | 3,4 | 4 016 |
| 7 | Germany | 1 264 | 30,1 | 3,3 | 4 199 |
| 8 | Republic of Korea | 800 | 39,3 | 2,1 | 2 035 |
| 9 | Saudi Arabia | 785 | 44,2 | 2,1 | 1 775 |
| 10 | Mexico | 778 | 31,6 | 2,1 | 2 463 |
| - | Top-10 | 22 883 | 30,4 | 60,5 | 75 348 |
| - | Other countries | 14 928 | 28,4 | 39,5 | 52 525 |
| - | Total | 37 811 | 29,6 | 100 | 127 873 |
Source: IMF, World Economic Outlook Database, Credinform calculations
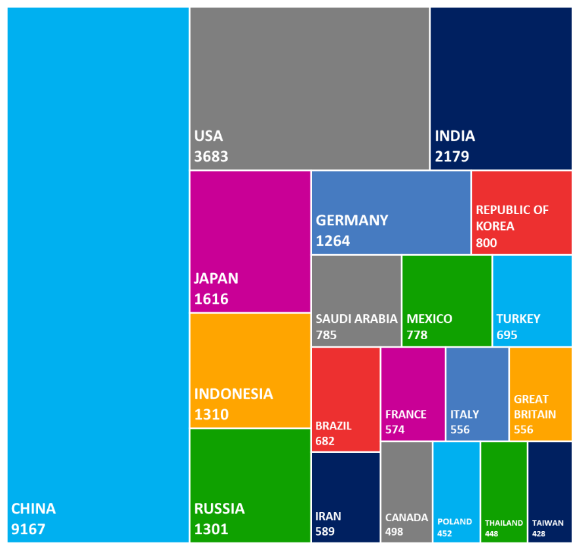
Picture 2 shows distribution of countries by contributions to industrial production. For example, the Great Britain is by 2,3 times behind of Russia – 1 301 billion USD versus 556 billion USD respectively. Once the largest global empire will lose economic and political significance after Brexit.
 Picture 1. Top-20 of countries in terms of industrial production volume for 2017, billion USD
Summing up
- China strengthens its status of “the world’s factory”. However, the increasing salaries and ageing of the population could lead to reverse process – corporations will transfer operations to the countries with low-paid work force (India, for instance).
- Due to availability of natural resources and highly developed sectors of heavy industry and fuel and energy complex, the Russia’s contribution to the global division of labor is significant and stable in the long view.
- Occident is losing momentum as the leading industrial countries.