Trends in food trade
Information agency Credinform has prepared a review of trends in activity of Russian food wholesalers.
The largest wholesalers (ТОP-1000) in terms of annual revenue were selected according to the data from the Statistical Register and the Federal Tax Service for the latest available periods (2014 - 2019). The company selection and analysis were based on data of the Information and Analytical system Globas.
Net assets is a ratio reflecting the real value of company's property. It is calculated annually as the difference between assets on the enterprise balance and its debt obligations. The ratio is considered negative (insufficiency of property), if company’s debt exceeds the value of its property.
The largest company in terms of net assets is JTI Russia LLC, INN 7703386329, Moscow, wholesale of tobacco products. In 2019 net assets of the company amounted to more than 48 billion RUB.
The smallest size of net assets in TOP-1000 had OOO TD DMITROGORSKII PRODUKT, INN 6911023162, Moscow region, non-specialised wholesale of food, beverages and tobacco. The company is in process of reorganization in the form of acquisition of other legal entities since 02.11.2020. The lack of property of the company in 2019 was expressed in negative terms -1,5 billion RUB.
For the last ten years, the average industry values of net assets showed the increasing tendency with growing dynamics of growth rates (Picture 1).
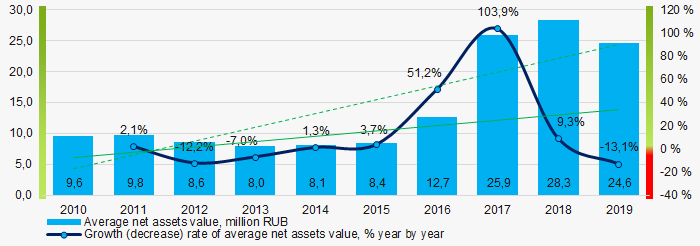 Picture 1. Change in average net assets value in 2014 – 2019
For the last six years, the share of ТОP-1000 enterprises with lack of property had the positive decreasing trend (Picture 2).
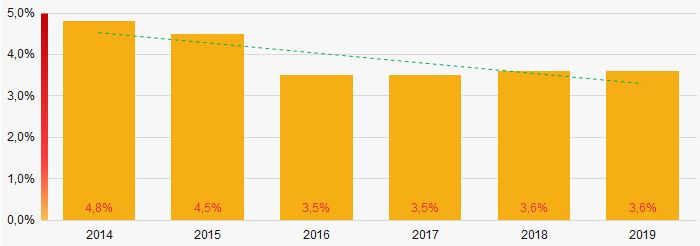 Picture 2. The share of enterprises with negative net assets value in ТОP-1000 in 2014-2019
Sales revenue
In 2019, the total revenue of 10 largest companies amounted to 41% from ТОP-1000 total revenue (Picture 3). This fact testifies the high level of monopolization in the industry.
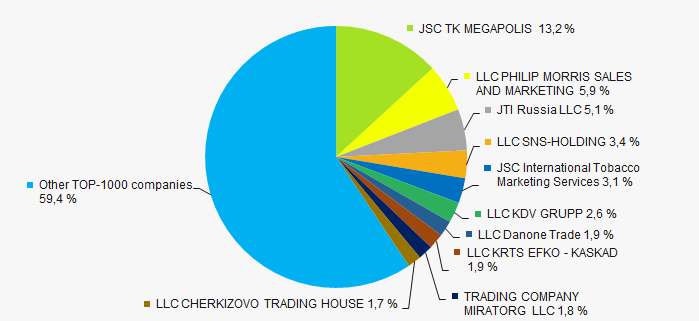 Picture 3. Shares of TOP-10 in TOP-1000 total revenue for 2019
In general, the decreasing trend in sales revenue with positive dynamics of growth rates is observed (Picture 4).
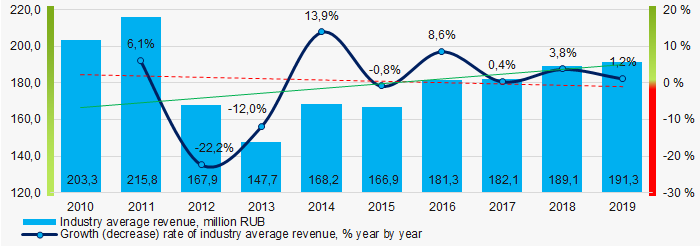 Picture 4. Change in average revenue in 2014 – 2019
 Profit and loss
The largest company in terms of net profit is also JTI Russia LLC, INN 7703386329, Moscow, wholesale of tobacco products. In 2019 the company’s profit amounted to more than 25,5 billion RUB.
For the last ten years, the average profit values show the growing tendency with the positive dynamics of growth rates (Picture 5).
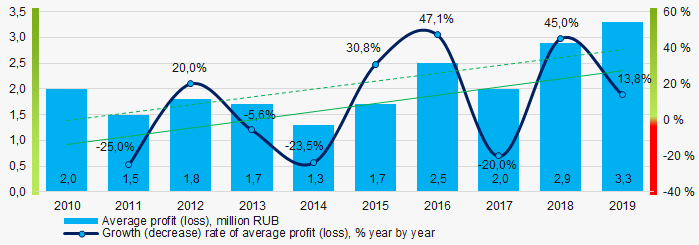 Picture 5. Change in average profit (loss) in 2010 – 2019
Over a six-year period, the average net profit values of ТОP-1000 show the growing tendency, along with this the average net loss is increasing (Picture 6).
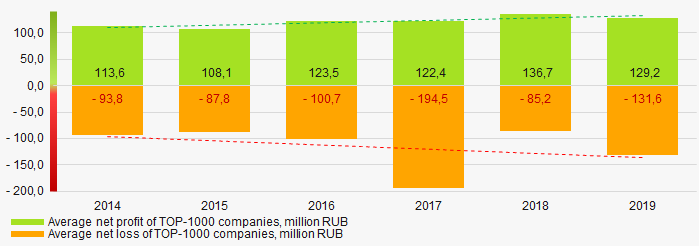 Picture 6. Change in average net profit/loss of ТОP-1000 companies in 2014 – 2019
Main financial ratios
For the last ten years, the average values of the current liquidity ratio were within the recommended values - from 1,0 to 2,0, with growing trend (Picture 7).
The current liquidity ratio (ratio of total working capital to short-term liabilities) shows the sufficiency of company’s assets to meet short-term obligations.
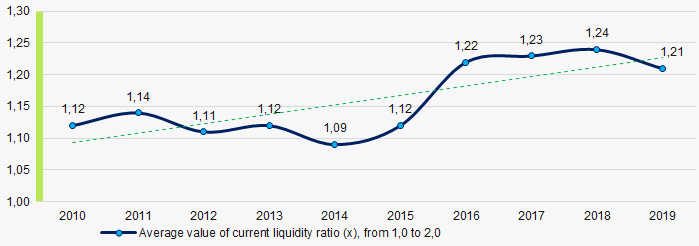 Picture 7. Change in average values of current liquidity ratio in 2010– 2019
Within ten years, the decreasing trend of the average values of ROI ratio is observed (Picture 8).
The ROI ratio is calculated as a ratio of net profit to sum of stockholder equity and long-term liabilities and shows the return from equity involved in commercial activities and long-term borrowed funds.
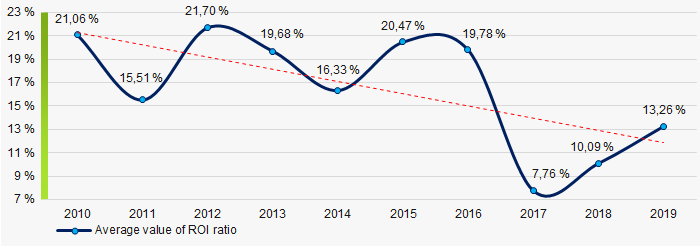 Picture 8. Change in average values of ROI ratio in 2010 – 2019
Assets turnover ratio is the ratio of sales revenue and company’s average total assets for a period. It characterizes the effectiveness of using of all available resources, regardless the source of their attraction. The ratio shows how many times per year the full cycle of production and circulation is performed, generating the corresponding effect in the form of profit.
For the last ten years, this business activity ratio demonstrated the decreasing trend (Picture 9).
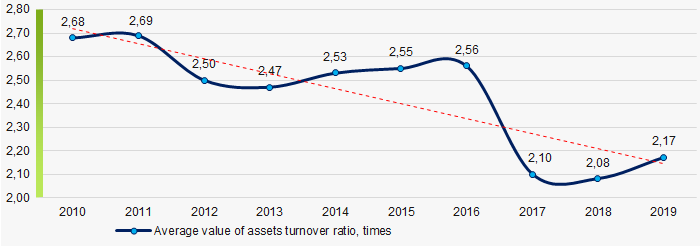 Picture 9. Change in average values of assets turnover ratio in 2010 – 2019
Small businesses
55% of ТОP-1000 companies are registered in the Unified register of small and medium-sized enterprises of the Russian Federal Tax Service. Herein, their share in TOP-1000 total revenue is 10,8%, which is almost twice lower than the national average value in 2018 – 2019 (Picture 10).
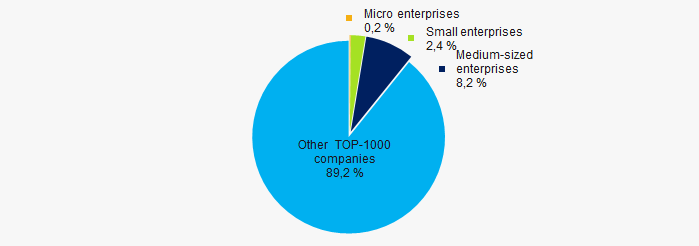 Picture 10. Shares of small and medium-sized enterprises in ТОP-1000
Main regions of activity
TOP-1000 companies are registered in 78 regions of Russia and are unequally located across the country. Almost 62% of the largest enterprises in terms of revenue are located Moscow region and Moscow (Picture 11).
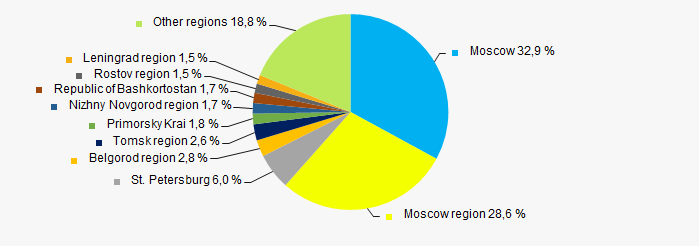 Picture 11. Distribution of TOP-1000 revenue by the regions of Russia
Financial position score
An assessment of the financial position of TOP-1000 companies shows that the largest part has the above average financial position (Picture 12).
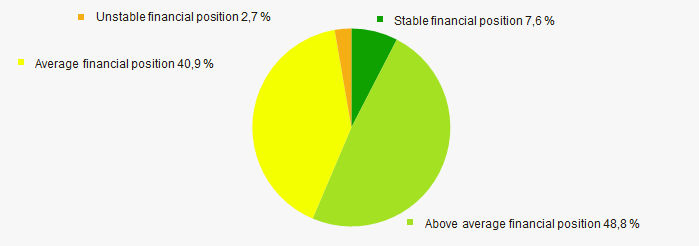 Picture 12. Distribution of TOP-1000 companies by financial position score
Solvency index Globas
Most of TOP-1000 companies got superior/high and strong/medium Solvency index Globas, this fact shows the ability of the companies to meet their obligations in time and fully (Picture 13).
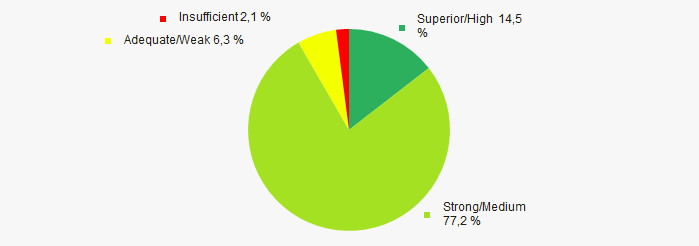 Picture 13. Distribution of TOP-1000 companies by Solvency index Globas
Conclusion
A complex assessment of food wholesalers, taking into account the main indexes, financial ratios and indicators, demonstrates the presence of positive trends within 2010-2019 (Table 1).
| Trends and assessment factors | Relative share, % |
| Dynamics of average net assets value |  10 10 |
| Growth/drawdown rate of average net assets value |  10 10 |
| Increase / decrease in the share of enterprises with negative net assets |  10 10 |
| The level of capital concentration |  -10 -10 |
| Dynamics of average net profit |  -10 -10 |
| Growth/drawdown rate of average revenue |  10 10 |
| Dynamics of average profit (loss) |  10 10 |
| Growth/drawdown rate of average profit (loss) |  10 10 |
| Increase / decrease in average net profit of companies |  10 10 |
| Increase / decrease in average net loss of companies |  -10 -10 |
| Increase / decrease in average values of current liquidity ratio |  10 10 |
| Increase / decrease in average values of ROI ratio |  -10 -10 |
| Increase / decrease in average values of assets turnover ratio, times |  -10 -10 |
| Share of small and medium-sized businesses by revenue more than 22% |  -10 -10 |
| Regional concentration |  -10 -10 |
| Financial position (the largest share) |  10 10 |
| Solvency index Globas (the largest share) |  10 10 |
| Average value of factors |  1,8 1,8 |
 favorable trend (factor),
  unfavorable trend (factor)
Absolute liquidity of bankrupt companies
Information agency Credinform represents a ranking of the Russian companies filed for bankruptcy. Companies with the largest volume of annual revenue (TOP-10 and TOP-1000) were selected for the ranking, according to the data from the Statistical Register and the Federal Tax Service for the latest available periods (2017 - 2019). They were ranked by the absolute liquidity ratio (Table 1). The selection and analysis of companies were based on the data of the Information and Analytical system Globas.
Absolute liquidity ratio (х) is absolute liquid assets to current liabilities.
The ratio determines the share of short-term liabilities which can be fulfiled by a company in the near-term rather than waiting until the collection of accounts receivable and sale of other assets.
The reccomended value of the ratio varies from 0,1 to 0,15. The higher the ratio, the better is the company’s solvency. However, extremely high values may be indicative of irrational capital structure and idle cash assets and funds in accounts, which depreciate over time and under the inflation, and lose their initial liquidity.
For the most complete and objective view of the financial condition of the enterprise, it is necessary to pay attention to the complex of indicators and financial ratios of the company.
| Name, INN, region, activity type, bankruptcy stage | Revenue, million RUB | Net profit (loss), million RUB | Absolute liquidity ratio (x), from 0,1 to 0,15 | Solvency index Globas | |||
| 2018 | 2019 | 2018 | 2019 | 2018 | 2019 | ||
| 1 | 2 | 3 | 4 | 5 | 6 | 7 | 8 |
| LLC TOMET INN 6382018657 Samara region, production of other chemical organic basic substances bankruptcy proceedings are initiated, 09.03.2021 |
 14 689,4 14 689,4 |
 12 663,1 12 663,1 |
 5 192,3 5 192,3 |
 2 303,0 2 303,0 |
 1,44 1,44 |
 0,65 0,65 |
600 Insufficient |
| JSC KRASNODARGAZSTROY INN 2308024336 Krasnodar territory, construction of utilities for water supply and sewerage, gas supply, supervision procedure, 08.11.2020 |
 34 055,4 34 055,4 |
 23 194,2 23 194,2 |
 -474,7 -474,7 |
 -2 286,5 -2 286,5 |
 0,02 0,02 |
 0,04 0,04 |
550 Insufficient |
| LLC TD INTERTORG INN 7842005813 Leningrad region, retail sale of unfrozen products, including beverages and tobacco products, in non-specialized stores bankruptcy proceedings are initiated, 24.02.2020 |
 73 929,6 73 929,6 |
 57 235,6 57 235,6 |
 721,5 721,5 |
 -11 198,1 -11 198,1 |
 0,08 0,08 |
 0,02 0,02 |
600 Insufficient |
| LLC KRAFT GRUPP INN 5001073882 Moscow, wholesale of metals in primary forms supervision procedure, 05.11.2020 |
 11 285,8 11 285,8 |
 13 674,7 13 674,7 |
 181,8 181,8 |
 185,1 185,1 |
 0,01 0,01 |
 0,01 0,01 |
550 Insufficient |
| LLC TOREKS INN 2723089170 Khabarovsk territory, processing of waste and scrap of ferrous metals, supervision procedure, 31.08.2020 |
 17 687,9 17 687,9 |
 19 861,9 19 861,9 |
 210,4 210,4 |
 126,9 126,9 |
 0,02 0,02 |
 0,01 0,01 |
266 Medium |
| LLC MERIDA INN 7704831847 Moscow, wholesale of solid, liquid and gaseous fuels and related products, supervision procedure, 20.02.2021 |
 27 410,3 27 410,3 |
 20 633,6 20 633,6 |
 1 231,9 1 231,9 |
 64,3 64,3 |
 0,01 0,01 |
 0,01 0,01 |
400 Weak |
| JSC ANTIPINSKY REFINERY INN 7204084481 Tyumen region, , production of petroleum products bankruptcy proceedings are initiated, 04.01.2020 |
 187 308,1 187 308,1 |
 49 424,1 49 424,1 |
 -35 763,0 -35 763,0 |
 -117 988,0 -117 988,0 |
 0,01 0,01 |
 0,00 0,00 |
600 Insufficient |
| LLC KIRIVSKAYA PZK INN 4706034802 Saint Petersburg, wholesale of metals in primary forms, открыто bankruptcy proceedings are initiated, 06.09.2020 |
 2 607,9 2 607,9 |
 12 348,8 12 348,8 |
 5,7 5,7 |
 21,8 21,8 |
 0,00 0,00 |
 0,00 0,00 |
600 Insufficient |
| LLC REGION-INVEST НЕФТЕПЕРЕРАБАТЫВАЮЩИЙ ЗАВОД INN 7733753865 Moscow, investment in securities, bankruptcy proceedings are initiated, 21.03.2020 |
 50 008,3 50 008,3 |
 37 253,2 37 253,2 |
 -149,8 -149,8 |
 -4 488,4 -4 488,4 |
 0,39 0,39 |
 0,00 0,00 |
600 Insufficient |
| LLC KVERS INN 3435074405 Volgograd region, non-specialized wholesale, bankruptcy proceedings are initiated, 06.09.2019 |
 145,2 145,2 |
 30 647,3 30 647,3 |
 0,3 0,3 |
 0,2 0,2 |
 0,06 0,06 |
 0,00 0,00 |
600 Insufficient |
| Average value for TOP-10 |  41 912,8 41 912,8 |
 27 693,7 27 693,7 |
 -2 884,4 -2 884,4 |
 -13 326,0 -13 326,0 |
 0,20 0,20 |
 0,08 0,08 |
|
| Average value for TOP-1000 |  1 688,6 1 688,6 |
 927,2 927,2 |
 -168,8 -168,8 |
 -347,5 -347,5 |
 0,04 0,04 |
 0,03 0,03 |
|
 growth of indicator to the previous period,
  decrease of indicator to the previous period
None of the TOP-10 company has the values of the absolute liquidity ratio within the recommended one. The average value of TOP-10 exceed the TOP-1000 values. In comparison with the previous period, the 2019 figures of four companies did not fall.
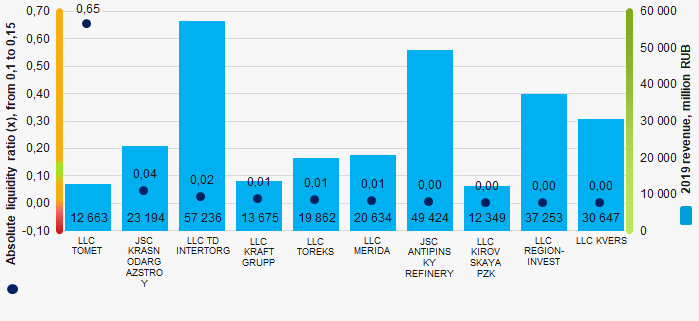 Picture 1. Absolute liquidity ratio and revenue of companies that filed for bankruptcy (TOP-10)
During six years, the average values of the absolute liquidity ratio of TOP-1000 had a downward trend (Picture 2).
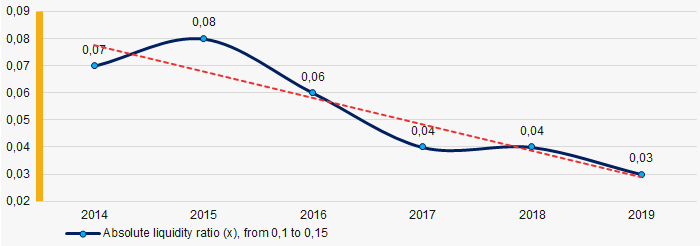 Picture 2. Change in the average values of the absolute liquidity ratio of the TOP-1000 companies that filed for bankruptcy in 2014 - 2019