
Order a report
Custom-made industry research, company ratings, competitor analysis


Activity trends in pharmaceuticals production
Information agency Credinform has observed trends in the activity of the largest Russian manufacturers of pharmaceuticals and medical products.
Enterprises with the largest volume of annual revenue (TOP-10 and TOP-1000) were selected for the analysis, according to the data from the Statistical Register for the latest available periods (for 2015-2017). The analysis was made on the basis of the data of the Information and Analytical system Globas.
Net assets is an indicator, reflecting the real value of company's property, is calculated annually as the difference between assets on the enterprise balance and its debt obligations. The indicator of net assets is considered negative (insufficiency of property), if company’s debt exceeds the value of its property.
The largest company in terms of net assets amount is JSC PHARMSTANDART-LEKSREDSTVA. In 2018 net assets of the company amounted to more than 3,1 billion RUB.
JSC F-SYNTHESIS had the smallest amount of net assets in the TOP-1000 group. Insufficiency of property of the company in 2018 was expressed in negative value -2,2 billion RUB.
For a ten-year period average amount of net assets of TOP-1000 companies has increasing tendency (Picture 1).
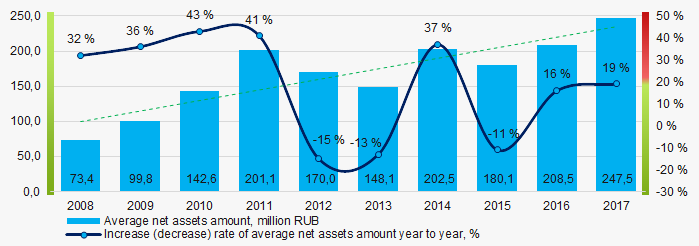 Picture 1. Change in average indicators of the net asset amount of manufacturers of pharmaceuticals and medical products in 2008 – 2017
Share of companies with insufficiency of property in the TOP-1000 demonstrate increasing tendency for the last five years (Picture 2).
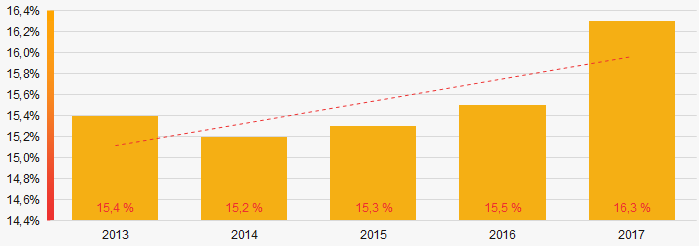 Picture 2. . Shares of companies with negative values of net assets in TOP-1000 companies in 2013 – 2017
Sales revenue
The revenue volume of 10 leaders of the industry made 35% of the total revenue of TOP-1000 companies in 2017 (Picture 3). It demonstrates relatively high level of competition in the industry.
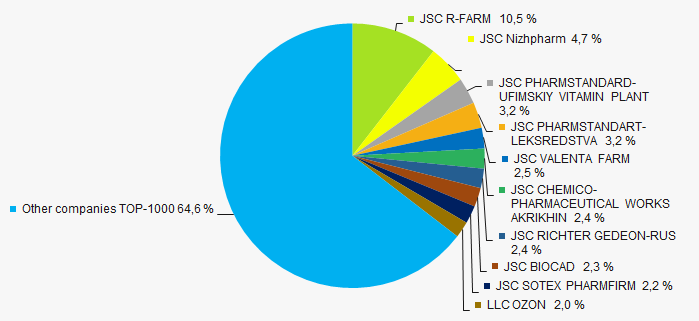 Picture 3. Shares of participation of TOP-10 companies in the total revenue of TOP-1000 companies for 2017
In general, over a ten-year period an increasing tendency in revenue volume is observed (Picture 4).
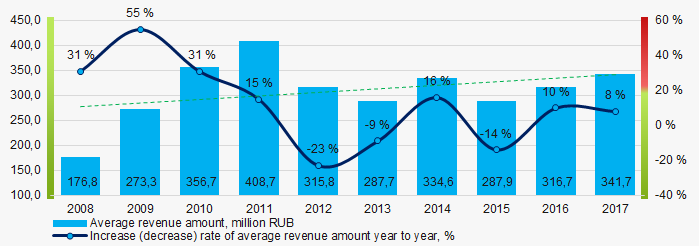 Picture 4. . Change in the average revenue of manufacturers of pharmaceuticals and medical products in 2008 – 2017
Profit and losses
The largest company in terms of net profit amount is JSC VALENTA FARM . Net profit of the company amounted to more than 4,7 billion RUB for 2018.
For the last ten years average industrial indicators of net profit have an increasing tendency (Picture 5).
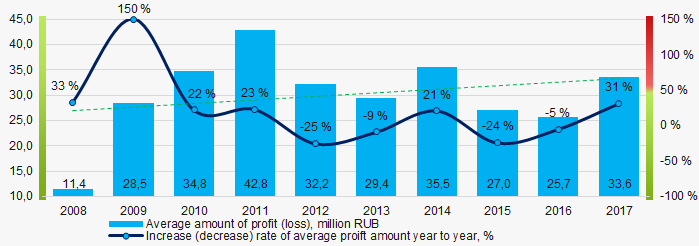 Picture 5. Change in the average indicators of net profit of manufacturers of pharmaceuticals and medical products in 2008 – 2017
Over a five-year period, the average values of net profit indicators of TOP-1000 companies tend to increase. Besides, the average value of net loss increases (Picture 6).
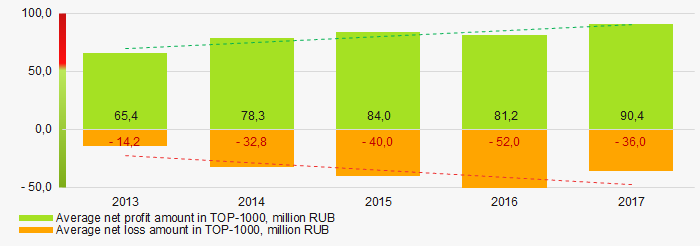 Picture 6.Change in the average indicators of net profit and loss of TOP-1000 companies in 2015 – 2017
Key financial ratios
Over the ten-year period the average indicators of the current liquidity ratio in general were within the range of recommended values – from 1,0 up to 2,0 with increasing tendency (Picture 7).
The current liquidity ratio (the relation of the amount of current assets to short-term liabilities) shows the sufficiency of company’s funds for repayment of its short-term liabilities.
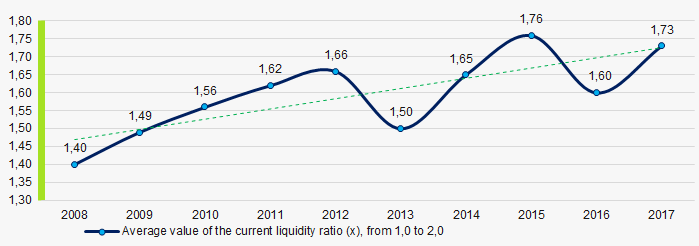 Picture 7. Change in the average values of the current liquidity ratio of manufacturers of pharmaceuticals and medical products in 2008 – 2017
Average values of the indicators of the return on investment ratio have decreasing tendency for ten years (Picture 8).
The ratio is calculated as the relation of net profit to the sum of own capital and long-term liabilities and demonstrates the return on the equity involved in the commercial activity of own capital and the long-term borrowed funds of an organization.
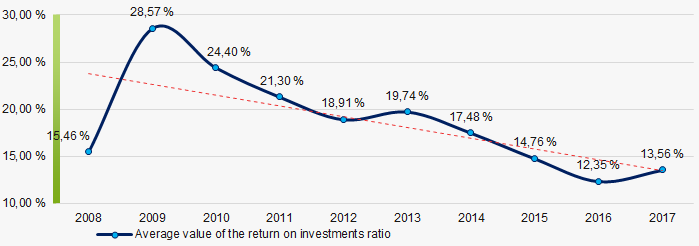 Picture 8. Change in the average values of the return on investment ratio of manufacturers of pharmaceuticals and medical products in 2008 – 2017
Asset turnover ratio is calculated as the relation of sales revenue to the average value of total assets for a period and characterizes the efficiency of use of all available resources, regardless of the sources of their attraction. The ratio shows how many times a year a complete cycle of production and circulation is made, yielding profit.
This business activity ratio showed a tendency to decrease for a ten-year period (Picture 9).
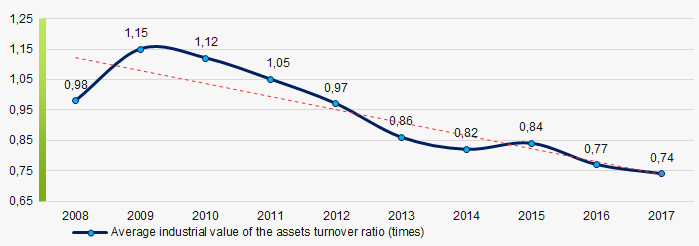 Picture 9. Change in the average values of the assets turnover ratio of manufacturers of pharmaceuticals and medical products in 2008 – 2017
Small business
76% of the TOP-1000 companies are registered in the Register of small and medium enterprises of the Federal Tax Service of the RF. Besides, share of revenue in the total volume in 2017 is 11,6%, that is twice as low as the average indicator countrywide (Picture 10).
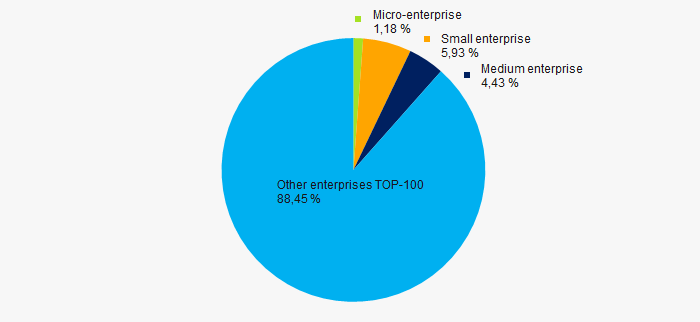 Picture 10. Shares of small and medium enterprises in TOP-1000 companies, %
Main regions of activity
TOP-1000 enterprises are unequally distributed along the territory of Russia and registered in 65 regions. Almost 52% of revenue volume is concentrated in Moscow and Moscow region (Picture 11).
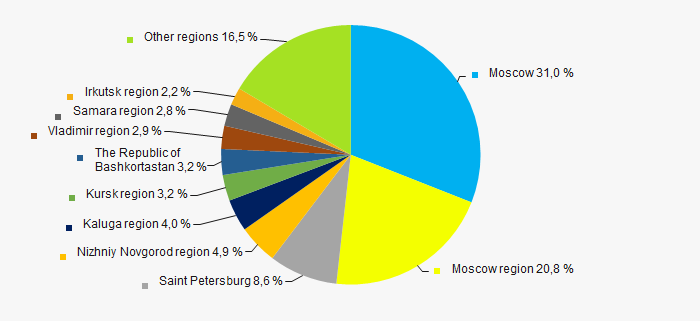 Picture 11. Distribution of TOP-1000 companies by regions of Russia
Financial position score
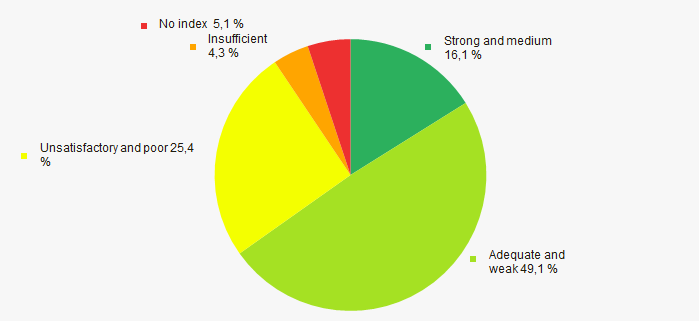
An assessment of the financial position of TOP-1000 companies shows that the largest number is in an average financial position. (Picture 12).
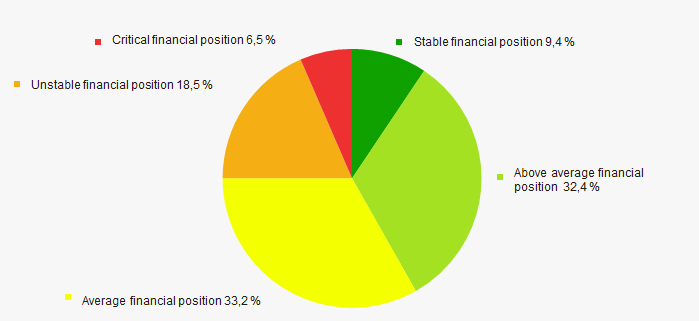 Picture 12. Distribution of TOP-1000 companies by financial position score
Solvency index Globas
Most of TOP-1000 companies have got from Medium to Superior Solvency index Globas, that points to their ability to repay their debts in time and fully (Picture 13).
 Picture 13.Distribution of TOP-1000 companies by solvency index Globas
Industrial production index
According to the data of the Federal State Statistics Service, increasing trend in indicators of the industrial production index is observed in the sphere of manufacture of pharmaceuticals and medical products in 2018 – 2019 (Picture 14). Besides, the average indicator from month to month amounted to 102,3%.
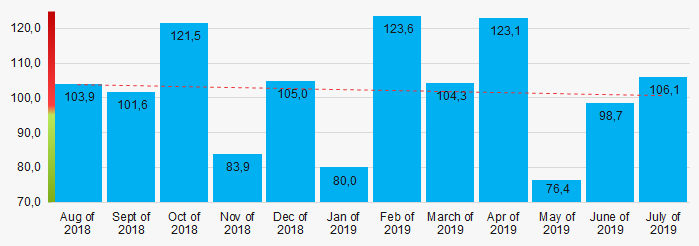 Picture 14. Production indexes in 2018 – 2019, (%)
According to the same data, share of the companies, engaged manufacture of pharmaceuticals and medical products in the volume of revenue from sale of goods, products, works and services countrywide in general amounted to 0,001% for 2018.
Conclusion
Comprehensive assessment of the activity of largest Russian manufacturers of pharmaceuticals and medical products, taking into account the main indexes, financial indicators and ratios, demonstrates the presence of favorable trends (Table 1).
| Trends and assessment factors | Share of factor, % |
| Rate of increase (decrease) of average amount of net assets | |
| Increase / decrease of share of companies with negative values of net assets | |
| Level of competition | |
| Increase (decrease) rate of average revenue amount | |
| Increase (decrease) rate of average net profit (loss) amount | |
| Increase / decrease of average net profit amount of TOP-1000 companies | |
| Increase / decrease of average net loss amount of TOP-1000 companies | |
| Increase / decrease of average industrial values of the current liquidity ratio | |
| Increase / decrease of average industrial values of the return on investments ratio | |
| Increase / decrease of average industrial values of the assets turnover ratio, times | |
| Share of small and medium enterprises in the industry in terms of revenue volume more than 22% | |
| Regional concentration | |
| Financial position (major share) | |
| Solvency index Globas (major share) | |
| Industrial production index | |
| Average value of factors | |
![]() positive trend (factor) ,
positive trend (factor) , ![]() negative trend (factor).
negative trend (factor).