
Order a report
Custom-made industry research, company ratings, competitor analysis


Absolute liquidity ratio of the largest Russian marine fishery companies
Information agency Credinform has prepared a ranking of the largest Russian marine fishery companies. The companies with the largest volume of annual revenue (TOP-10) have been selected for the ranking, according to the data from the Statistical Register for the latest available accounting periods (2016 and 2015). Then they have been ranked by absolute liquidity ratio in 2016 (Table 1). The analysis was based on the data from the Information and Analytical system Globas.
Absolute liquidity ratio (x) is a ratio of total cash available to the company’s current liabilities. The ratio measures the share of current liabilities which the company can meet in the short term, without waiting for collection of receivables and other assets’ realization. Its recommended value is from 0,1 to 0,15. The higher the ratio the better the company’s solvency is.
However, an excessive value may indicate an irrational capital structure and presence of idle assets such as cash and deposits that show depreciation in the course of time and due to inflation, and lose their original liquidity.
A calculation of practical values of financial ratios, which might be considered as normal for a certain industry, has been developed and implemented in the Information and Analytical system Globas by the experts of the Information Agency Credinform, having taken into account the current situation in the economy as a whole and in the industries. The practical value of absolute liquidity ratio for marine fishery companies amounted from 0 to 0,43 in 2016.
The whole set of financial indicators and ratios of a company is to be considered to get the fullest and fairest opinion about the company’s financial standing.
| Name, INN, region | ЧNet profit, mln RUB | Net profit, mln RUB | Absolute liquidity ratio (х) | Solvency index Globas | |||
| 2015 | 2016 | 2015 | 2016 | 2015 | 2016 | ||
| 1 | 2 | 3 | 4 | 5 | 6 | 7 | 8 |
| VostokRybProm LLC INN 2721023255 Khabarovsk territory |
180,0 | 2 207,2 | 3 588,3 | 5 190,8 | 0,00 | 0,00 | 204 Strong |
| OceanRybFlot PJSC INN 4100000530 Kamchatka territory |
3 810,5 | 3 735,3 | 16 121,3 | 15 351,2 | 0,05 | 0,01 | 194 High |
| Nakhodka Active Marine Fishery Base PJSC INN 2508007948 Primorye territory |
2 309,7 | 2 735,3 | 2 852,9 | 9 664,5 | 0,03 | 0,02 | 181 High |
| Sakhalin Leasing Fleet NJSC INN 6509006140 Sakhalin region |
-2 803,1 | 2 536,7 | 3 531,8 | 4 757,9 | 0,02 | 0,02 | 253 Medium |
| Roliz LLC INN 2536247860 Kamchatka territory |
966,6 | 1 597,7 | 5 068,3 | 5 305,0 | 0,13 | 0,08 | 215 Strong |
| Murmansk Trawl Fleet PJSC INN 5100000010 Murmansk region |
1 400,4 | 2 160,7 | 10 945,07 | 10 121,0 | 0,72 | 0,21 | 179 High |
| AKROS Fishing PJSC INN 4101013772 Kamchatka territory |
-551,2 | 2 692,7 | 5 452,4 | 6 119,2 | 0,08 | 0,23 | 208 Strong |
| Arkhangelsk Trawl Fleet PJSC INN 2901128602 Archangelsk region |
2 665,2 | 1 860,6 | 5 763,9 | 6 337,8 | 1,91 | 0,31 | 133 Superior |
| Fishing Artel Collective Farm Fishery named after V.I. Lenin INN 4101016808 Kamchatka territory |
1 759,0 | 2 450,7 | 5 442,8 | 6 382,1 | 1,06 | 0,50 | 149 Superior |
| Preobrazhenskaya Base of Trawling Fleet PJSC INN 2518000814 Primorye territory |
1 228,4 | 1 019,0 | 6 307,5 | 6 307,5 | 0,53 | 0,87 | 160 Superior |
| Total for TOP-10 companies | 1 096,5 | 2 299,6 | 7 007,4 | 7 612,4 | |||
| Average value of TOP-10 companies | 109,7 | 230,0 | 700,7 | 761,2 | 0,45 | 0,23 | |
| Industry average value | 26,1 | 32,3 | 103,4 | 108,4 | 0,18 | 0,18 | |
Average absolute liquidity ratio of TOP-10 companies in 2016 is higher than the recommended one and within practical values. In 2016 two companies of TOP-10 have a ratio higher, and the rest companies have a ratio within the practical value (green and orange colors respectively in columns 6 and 7 of Table 1 and in Picture 1). Furthermore, two companies show an improvement of the ratio in 2016 as compared to the previous period (green highlight in column 7 of Table 1). In 2016 four of TOP-10 companies have a decrease in net profit or revenue as compared to the prior period (red highlight in columns 3 and 5 of Table 1).
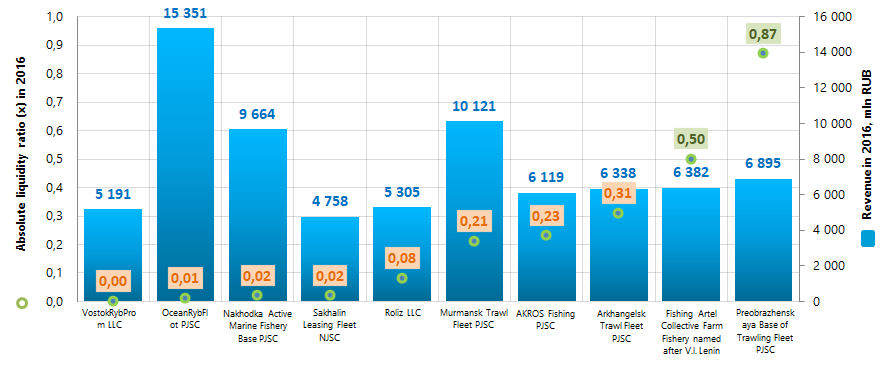 Picture 1. Absolute liquidity ratio and revenue of the largest Russian marine fishery companies (TOP-10)
Industry average values of absolute liquidity ratio within the last 10 years follow an upward trend. In 2007 and 2008 the ratio value was lower than the recommended one. In general, this may indicate a certain solvency improvement in the sector (Picture 2).
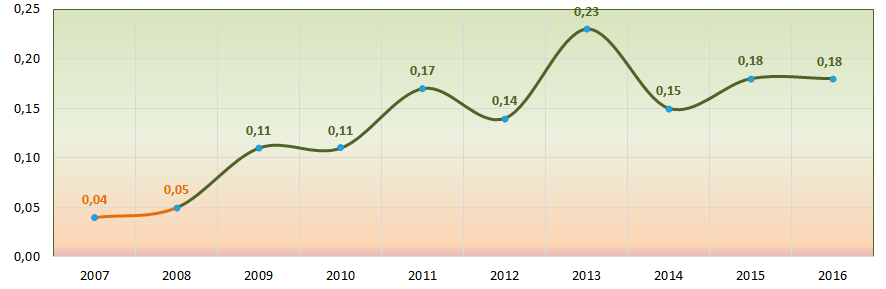 Picture 2. Change of industry average values of absolute liquidity ratio in 2007 – 2016
All TOP-10 companies have got from superior to medium solvency index Globas, which indicates their ability to meet debt obligations timely and in full.