State information system of housing and communal services was created
According to the order of the President of the RF № Pr-3081 from 13.10.2011, the Federal Law from July 21, 2014 of №209-FZ «On the state information system of housing and communal services» (HGS GIS) was prepared and entered into force.
The purpose of HGS GIS was to replace scattered sites with information of management companies, various departments of HGS and other organizations with the unified resource, covering practically all information in the sphere of housing and communal services.
According to the initiators and developers of the system, it should give the citizens the opportunity to obtain complete, actual and reliable data about management companies, the works carried out and services provided, their cost and other necessary information about the housing and communal services, and will let government authorities make educated and informed management decisions.
The Ministry of Communications and Mass Media of the RF is the operator of HGS GIS, which has developed the system together with the Ministry of Construction and Housing and Utilities of the RF and the Federal State Unitary Enterprise «Russian Post».
The state information system of housing and communal services is integrated with information systems of the Federal Service for State Registration, Cadastre and Cartography, as well as with antimonopoly and tax services.
The system is divided into open and closed parts. The following information is available in the open part:
- legal acts and other normative documents;
- registers of open data: housing facilities, providers of information, inspections, information about heating season preparedness, licenses of constituent entities of the RF, consolidated register of licenses, register of disqualified persons and the list of government authorities;
- tariffs for housing and communal services and indexes of the change of payment for them;
- information on subsidies and benefits for consumers;
- standards of municipal services.
The closed part includes personal profiles of citizens, management companies and government authorities.
Citizens can use the system on a voluntary basis and for organizations of housing and communal services and government authorities the connection and work in HGS GIS is of obligatory character. Thus, according to final provisions of the law, since July 1, 2016 all providers and operators of housing and communal services are required to place information in the system. Since January 1, 2017 in case the data on the amount of payment for a residential unit and municipal services is not placed in the system, or such information does not correspond to the payment document in hard copy, this billing document will not be deemed submitted in accordance with the requirements of the legislation of the RF.
As of August 25, 2016, 58 158 enterprises from 85 constituent entities of the RF are registered in the system. By this, 100% of organizations of housing and communal services are registered in Orel region, the Chechen Republic, the Republic of Altai, the Khanty-Mansi Autonomous District and the Nenets Autonomous District. More than 90% of organizations of housing and communal services are registered in the Republic of Khakassia, Moscow, the Chukotka Autonomous District and Krasnoyarsk territory. In 16 regions of the country less than half companies of housing and communal services are registered in the system, and Ivanovo region has the lowest rate of 27,73%.
Product profitability of the largest Russian grain manufacturers
Information agency Credinform presents a ranking of the largest Russian grain manufacturers in terms of product profitability ratio.
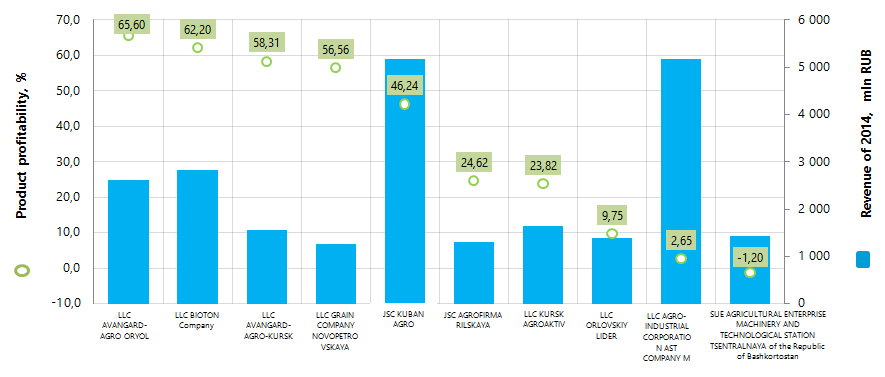
The companies with the highest volume of revenue were selected for this ranking according to the data for the latest available period (2014). These enterprises were ranked by decrease in product profitability ratio. (Table 1).
Product profitability (%) is calculated as the ratio of sales profit to expenses from ordinary activities. In general, profitability reflects the economic efficiency of production. Product profitability analysis allows us to make a conclusion whether output of one or another product is reasonable. There are no prescribed values for indicators of this group, because they vary strongly depending on the industry.
| Name, INN, region | Net profit 2014, mln RUB | Revenue of 2014, mln RUB | Revenue of 2014 to 2013, % | Product profitability, % | Solvency index Globas-i® |
|---|---|---|---|---|---|
| LLC AVANGARD-AGRO ORYOL INN 5722033156 Oryol region |
1 036,9 | 2 607,0 | 214 | 65,60 | 226 High |
| LLC BIOTON Company INN 6367044243 Samara region |
1 221,0 | 2 830,5 | 136 | 62,20 | 155 The highest |
| LLC AVANGARD-AGRO-KURSK INN 4607004691 Kursk region |
379,0 | 1 555,0 | 150 | 58,31 | 255 High |
| LLC GRAIN COMPANY NOVOPETROVSKAYA INN 2349031389 Krasnodar territory |
215,6 | 1 252,6 | 246 | 56,56 | 247 High |
| JSC KUBAN AGRO INN 2356045713 Krasnodar territory |
1 110,2 | 5 166,5 | 154 | 46,24 | 210 High |
| JSC AGROFIRMA RILSKAYA INN 4620008021 Kursk region |
240,1 | 1 304,7 | 124 | 24,62 | 235 High |
| LLC KURSK AGROAKTIV INN 4611010458 Kursk region |
-448,8 | 1 631,8 | 226 | 23,82 | 327 Satisfactory |
| LLC ORLOVSKIY LIDER INN 5706004687 Oryol region |
34,0 | 1 387,9 | 112 | 9,75 | 550 Unsatisfactory |
| LLC AGRO-INDUSTRIAL CORPORATION AST COMPANY M INN 7721147115 Moscow |
64,7 | 5 170,7 | 163 | 2,65 | 199 The highest |
| SUE AGRICULTURAL ENTERPRISE MACHINERY AND TECHNOLOGICAL STATION TSENTRALNAYA of the Republic of Bashkortostan INN 245022178 the Republic of Bashkortostan |
9,0 | 1 433,5 | 109 | -1,20 | 229 High |
LLC AGRO-INDUSTRIAL CORPORATION AST COMPANY M and JSC KUBAN AGRO have got the highest revenue in the industry for 2014. According to the product profitability ratio, these enterprises take ninth and fifth places. Shares of each of those in total revenue volume of TOP-10 companies are more than 21%.
LLC AVANGARD-AGRO ORYOL demonstrates the highest product profitability ratio 65,6%.
Following the results of 2014, increase in revenue is observed for all TOP-10 companies, and LLC KURSK AGROAKTIV and LLC ORLOVSKIY LIDER showed decrease in net profit or loss.
SUE AGRICULTURAL ENTERPRISE MACHINERY AND TECHNOLOGICAL STATION TSENTRALNAYA of the Republic of Bashkortostan has got negative value of product profitability ratio.
In general, summarizing the financial and nonfinancial data, eight companies from the TOP-10 list have got the highest or high solvency index Globas-i. This demonstrates their ability to pay off the debts in time and to the full extent.
LLC KURSK AGROAKTIV has got satisfactory solvency index Globas-i due to the information about company being a defendant in debt collection arbitration proceedings, as well as about loss in financial accounts.
LLC ORLOVSKIY LIDER has got unsatisfactory solvency index Globas-i due to the information about bankruptcy claim.
The average product profitability value among TOP-10 companies in 2014 is 34,86%.

Total revenue volume of TOP-10 companies in 2014 is 23,3 bln RUB, that is 55% higher than in 2013. Total net profit of this group for the same period increased more than double.
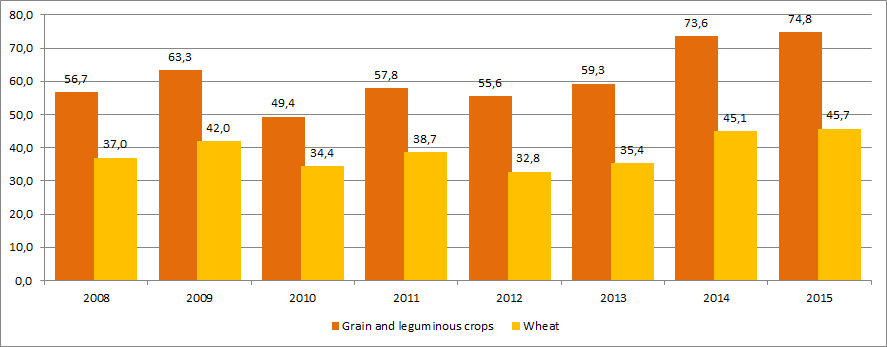
In general, enterprises operate profitably. The industry demonstrates positive dynamics in grain production. According to the data of the Federal State Statistics Service (Rosstat), grain realization by the enterprises of all kinds has been constantly growing since 2012. (Picture 2).

According to recent data of Rosstat, grain and leguminous crops were harvested at farms of all kinds (th tons):
| On August, 1 | On November, 1 | |||
|---|---|---|---|---|
| 2014 | 2015 | 2016 | 2014 | 2015 |
| 35 026,57 | 28 817,64 | 33 756,21 | 105 664,1 | 105 760,2. |
Grain producing companies are located in regions with the best environment for agricultural production. According to the data of the Information and analytical system Globas-i, 100 largest companies are registered in 27 regions in terms of revenue volume for 2014. Most of them are registered in the following regions (TOP-9 regions):
| Region | Number of companies |
|---|---|
| Krasnodar territory | 17 |
| Stavropol territory | 13 |
| Kursk region | 12 |
| Lipetsk region | 7 |
| Oryol region | 6 |
| Belgorod region | 4 |
| Voronezh region | 4 |
| Omsk region | 4 |
| Rostov region | 4 |