
Order a report
Custom-made industry research, company ratings, competitor analysis


Trends in housing and utility sector
Information agency Credinform has prepared a review of trends in activity of the largest Russian companies engaged in housing management.
The largest Russian companies engaged in housing management (TOP-10 and TOP-1000) in terms of annual revenue were selected according to the data from the Statistical Register for the latest available periods (2015 - 2017). The analysis was based on data of the Information and Analytical system Globas.
Net assets is a ratio reflecting the real value of company's property. It is calculated annually as the difference between assets on the enterprise balance and its debt obligations. The ratio is considered negative (insufficiency of property), if company’s debt exceeds the value of its property.
| № | Name, INN, region | Net assets value, mln RUB |
Solvency index Globas | ||
| 2015 | 2016 | 2017 | |||
| 1 | 2 | 3 | 4 | 5 | 6 |
| 1 | STATE UNITARY ENTERPRISE MOSCOW CITY CENTER OF RENTAL HOUSING INN 7703202003 Moscow In process of reorganization in the form of accession since 07.06.2018 |
12613 | |
|
600 Insufficient |
| 2 | GUPSRF MOSCOW DIRECTORATE FOR OPERATION OF BUILDINGS, ENGINEERING STRUCTURES AND COMMUNICATIONS INN 7719005931 Moscow |
1379 | |
|
179 High |
| 3 | MUUP HOUSING AND UTILITIES OF CHEKHOV DISTRICT INN 5048052077 Moscow region |
969 | |
|
212 Strong |
| 4 | МMUUP ADMINISTRATION OF COMMUNICATION COMPLEX OF NORTH-YENISEI DISTRICT INN 2434001177 Krasnoyarsk region |
979 | |
|
265 Medium |
| 5 | MUUP THE HOUSING OF KIRISHI URBAN SETTLEMENT OF KIRISHI MUNICIPAL DISTRICT INN 4708001129 Leningrad region |
590 | |
|
254 Medium |
| 996 | PAO HOUSING AUTHORITY OF ORDZHONIKIDZEVSKY DISTRICT, UFA, REPUBLIC OF BASHKORTOSTAN INN 0277101778 Republic of Bashkortostan |
-592 | |
|
358 Adequate |
| 997 | LLC HOUSING AND UTILITIES OF PETROPAVLOVSK-KAMCHATSKY INN 4101122429 Kamchatka Krai |
-686 | |
|
378 Adequate |
| 998 | LLC MANAGEMENT COMPANY KRASZHILSERVIS INN 2465090650 Krasnoyarsk region Process of being wound up since 15.08.2016 |
-609 | |
|
600 Insufficient |
| 999 | LLC NORDENERGO INN 7801289210 Saint-Petersburg Process of being wound up since 22.06.2017 |
42 | |
|
600 Insufficient |
| 1000 | LLC MAIN HOUSING DEPARTMNET INN 7704307993 Moscow Case on declaring the company bankrupt (insolvent) is proceeding |
7 | |
|
600 Insufficient |
![]() — growth indicator in comparison with prior period,
— growth indicator in comparison with prior period, ![]() — decline indicator in comparison with prior period.
— decline indicator in comparison with prior period.
For the last ten years, the average values of TOP-1000 net assets showed the decreasing tendency (Picture 1).
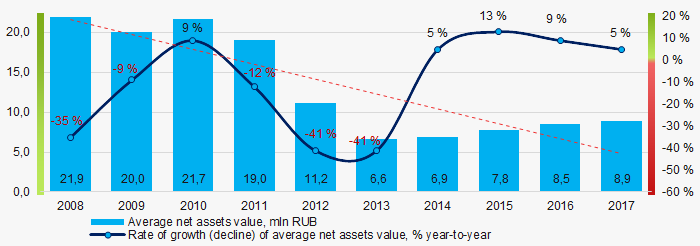 Picture 1. Change in average net assets value of companies engaged in housing management in 2008 – 2017
 For the last three years, the share of enterprises with lack of property is growing (Picture 2).
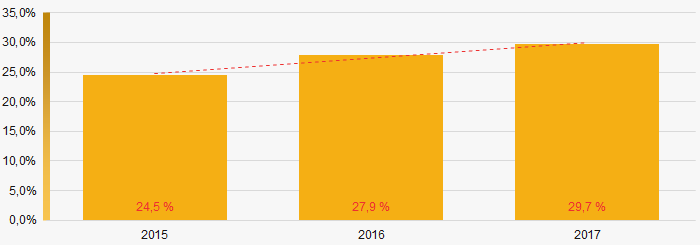 Picture 2. The share of enterprises with negative net assets value in ТОP-1000 in 2015 – 2017
Sales revenue
In 2017, the total revenue of 10 largest companies amounted to 11% from ТОP-1000 total revenue (Picture 3). This fact testifies high level of competition within the industry.
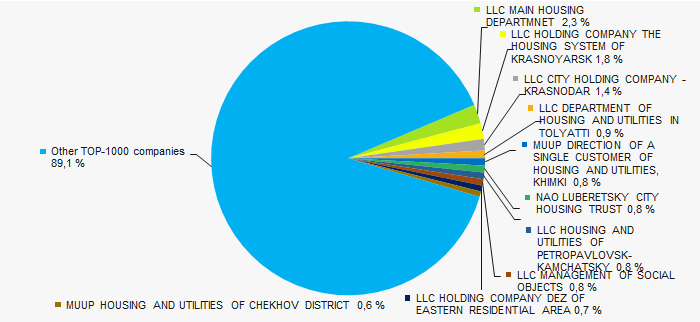 Picture 3. Shares of TOP-10 in TOP-1000 total revenue for 2017
In general, over a ten-year period the decrease in sales revenue is observed (Picture 4).
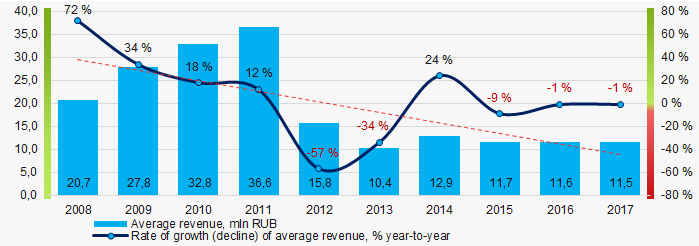 Picture 4. Change in average revenue of companies engaged in housing management in 2008 – 2017
 Profit and loss
In 2017 profit of 10 largest companies amounted to 37% from TOP-1000 total profit (Picture 5).
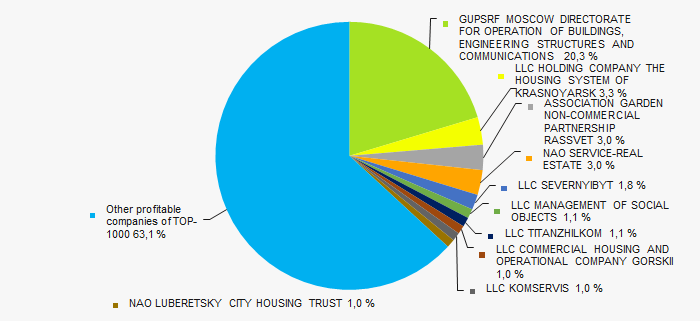 Picture 5. Shares of TOP-10 companies in TOP-1000 total profit for 2017"
For the last ten years, the average net profit values are mainly negative and show the downward trend (Picture 6).
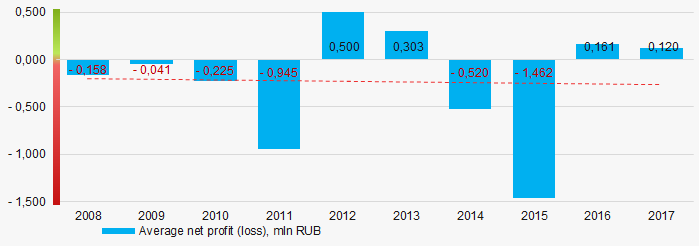 Picture 6. Change in average net profit of companies engaged in housing management in 2008 – 2017"
Over a three-year period, the average net profit values of ТОP-1000 show the growing tendency, along with this the average net loss also increases (Picture 7).
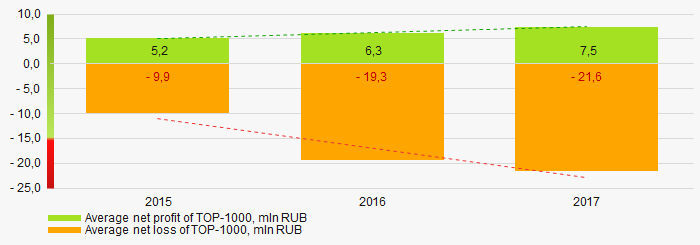 Picture 7. Change in average profit/loss of ТОP-1000 companies in 2015 – 2017 "
Main financial ratios
For the last ten years, the average values of the current liquidity ratio were within the recommended values - from 1,0 to 2,0, with growing tendency (Picture 8).
The current liquidity ratio (ratio of total working capital to short-term liabilities) shows the sufficiency of company’s assets to meet short-term obligations.
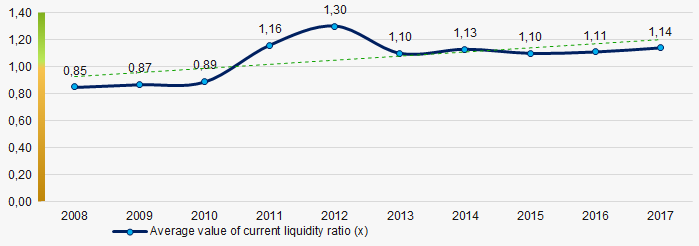 Picture 8. Change in average values of current liquidity ratio of companies engaged in housing management in 2008 – 2017"
For the last ten years, the decreasing tendency of ROI ratio is observed (Picture 9).
The ROI ratio is calculated as a ratio of net profit to sum of stockholder equity and long-term liabilities and shows the return from equity involved in commercial activities and long-term borrowed funds.
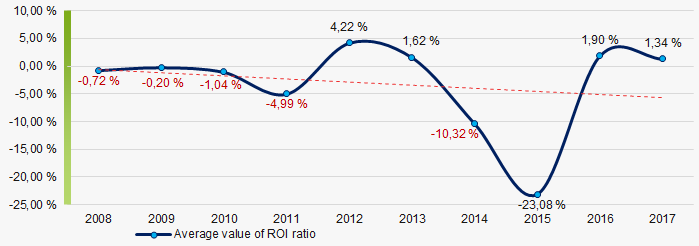 Picture 9. Change in average values of ROI ratio in 2008 – 2017 "
Assets turnover ratio is the ratio of sales revenue and company’s average total assets for a period. It characterizes the effectiveness of using of all available resources, regardless the source of their attraction. The ratio shows how many times per year the full cycle of production and circulation is performed, generating the corresponding effect in the form of profit
For the last ten years, this business activity ratio demonstrated the downward trend (Picture 10).
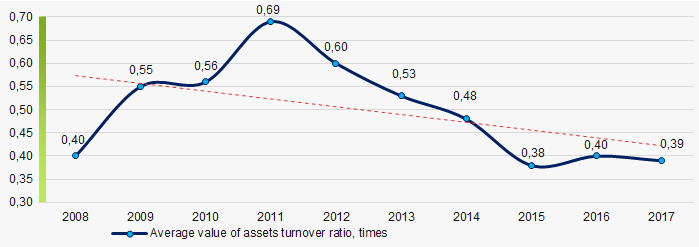 Picture 10. Change in average values of assets turnover ratio of companies engaged in housing management in 2008 – 2017"
Production structure
67% of ТОP-1000 companies are registered in the Unified register of small and medium-sized enterprises of the Russian Federal Tax Service. Herein, in 2017 their share in TOP-1000 total revenue amounted to 46% (Picture 11).
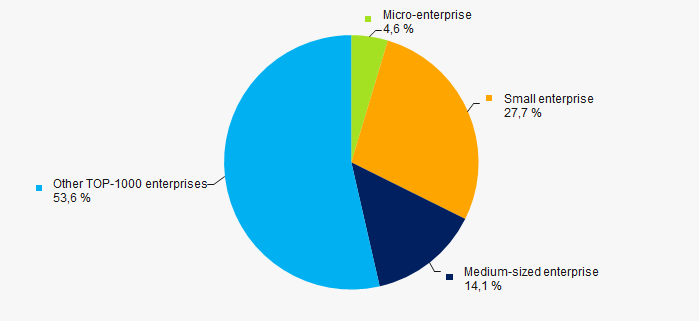 Picture 11. Shares of small and medium-sized enterprises in ТОP-1000, %"
Main regions of activity
Companies of ТОP-1000 are unequally located across the country and registered in 71 regions of Russia. The largest enterprises in terms of revenue are located in Moscow region (Picture 12).
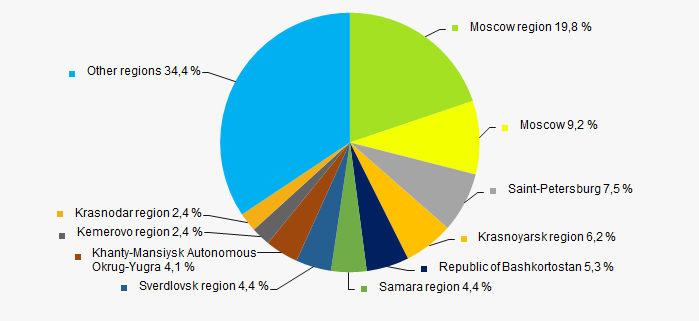 Picture 12. Distribution of TOP-1000 revenue by the regions of Russia"
Financial position score
An assessment of the financial position of TOP-1000 companies shows that more than a half of them have average financial position (Picture 13).
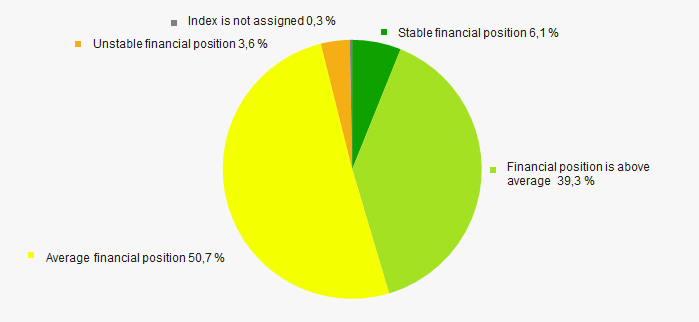 Picture 13. Distribution of TOP-1000 companies by financial position score"
Solvency index Globas
Most of TOP-1000 companies got superior/high or strong/medium Solvency index Globas, this fact shows the ability of the companies to meet their obligations in time and fully (Picture 14).
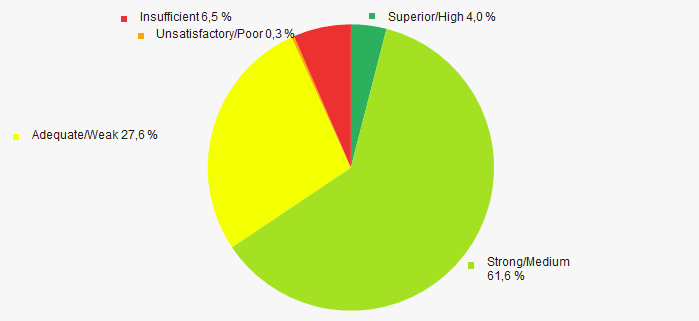 Picture 14. Distribution of TOP-1000 companies by Solvency index Globas"
Conclusion
A complex assessment of activity of the largest Russian companies engaged in housing management, taking into account the main indexes, financial ratios and indicators, demonstrates the presence of unfavorable trends (Table 2).
| Trends and assessment factors | Relative share, % |
| Growth/drawdown rate of average net assets value | |
| Increase / decrease in the share of enterprises with negative net assets | |
| Growth/drawdown rate of average revenue | |
| Competition level | |
| Growth/drawdown rate of average net profit (loss) | |
| Increase / decrease in average net profit of TOP-1000 companies | |
| Increase / decrease in average net loss of TOP-1000 companies | |
| Increase / decrease in average values of current liquidity ratio | |
| Increase / decrease in average values of ROI ratio | |
| Increase / decrease in average values of assets turnover ratio, times | |
| Share of small and medium-sized businesses in the industry by revenue more than 20% | |
| Regional concentration | |
| Financial position (the largest share) | |
| Solvency index Globas (the largest share) | |
| Average value of factors | |
![]() — Favorable trend (factor),
— Favorable trend (factor), ![]() — unfavorable trend (factor).
— unfavorable trend (factor).