
Order a report
Custom-made industry research, company ratings, competitor analysis


Return on sales of nitrogen fertilizer makers
Information agency Credinform offers to get acquainted with the ranking of Russian nitrogen fertilizer makers. The companies with the highest volume of revenue involved in this activity were selected by the experts according to the data from the Statistical Register for the latest available period (for the year 2013). Then, the first 10 enterprises selected by turnover were ranked by decrease in return on sales ratio.
Return on sales ratio is calculated as the relation of operating income (before-tax income) to turnover and is an indicator of the pricing policy of a company, presenting its ability to monitor its costs. Negative values of the indicator testify that expenses of an enterprise exceed revenues from sales of products, what is an unfavorable trend. Recommended value of the indicator varies depending on the industry.
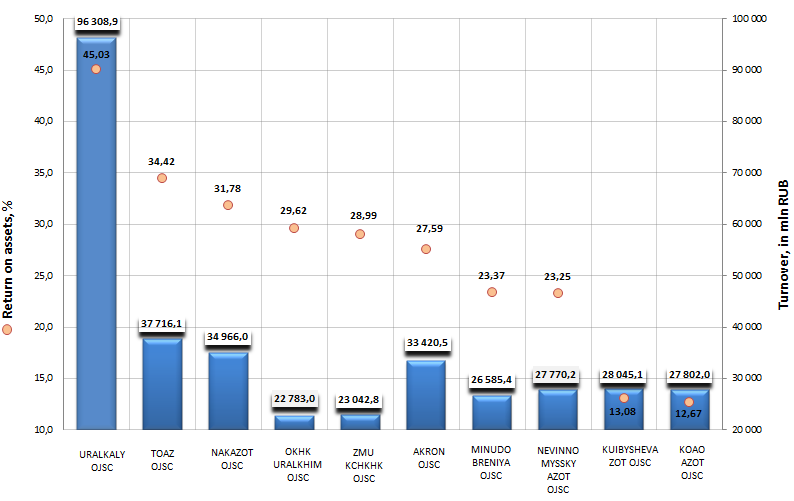
| № | Name, INN | Region | Turnover for 2013, in mln RUB | Return on sales, % | Solvency index GLOBAS-i® |
|---|---|---|---|---|---|
| 1 | Uralkaly OJSC INN 5911029807 |
Perm territory | 96 309 | 45,03 | 193 (the highest) |
| 2 | Tolyatti azot OJSC INN 6320004728 |
Samara region | 37 716 | 34,42 | 153 (the highest) |
| 3 | Novomoskovskaya aktsionernaya kompaniya Azot OJSC INN 7116000066 |
Tula region | 34 966 | 31,78 | 153 (the highest) |
| 4 | Ob’edinennaya khimicheskaya kompaniya Uralkhim OJSC INN 7703647595 |
Moscow | 22 783 | 29,62 | 280 (high) |
| 5 | Zavod mineralnykh udobreny Kirovo-Chepetskogo khimicheskogo kombinata OJSC INN 4312138386 |
Moscow | 23 043 | 28,99 | 196 (the highest) |
| 6 | Akron OJSC INN 5321029508 |
Novgorod region | 33 421 | 27,59 | 284 (high) |
| 7 | Minudobreniya OJSC INN 3627000397 |
Voronezh region | 26 585 | 23,37 | 198 (the highest) |
| 8 | Nevinnomyssky azot OJSC INN 2631015563 |
Stavropol territory | 27 770 | 23,25 | 189 (the highest) |
| 9 | Kuibyshevazot OJSC INN 6320005915 |
Samara region | 28 045 | 13,08 | 173 (the highest) |
| 10 | Kemerovskoe aktsionernoe obshchestvo Azot OJSC INN 4205000908 |
Kemerovo region | 27 802 | 12,67 | 210 (high) |
Russian industry sector of mineral fertilizers is one of leading branches in the world. On the volume of production of nitrogen and potash fertilizers domestic manufacturers take the second place in the world, 18,5% from world output is accounted for by them. By that about 70% of products manufactured on the territory of Russia go for export.
Cumulative turnover of the largest TOP-10 Russian nitrogen fertilizer makers made 358,4 bln RUB at year-end 2013.
Return on sales of all TOP-10 companies of this ranking is above 12%, what testifies to high efficiency of this activity and smart policy of company’s management toward production costs. All enterprises of the ranking got a high and the highest solvency index GLOBAS-i®, what testifies to that the mentioned organizations can pay off their debts in time and fully.
Return on sales of Russian nitrogen fertilizer makers, TOP-10
The first three companies of the ranking are as follows: Uralkaly OJSC (value of return on sales - 45,03%), Tolyattiazot OJSC (34,42%) and Novomoskovskaya aktsionernaya kompaniya Azot OJSC (31,78%). The values of return on sales of the leaders of the ranking are above 30%, what testifies to high efficiency of their activity. Besides that, all enterprises got the highest solvency index GLOBAS-i®, what characterizes the mentioned organizations as financially stable.
Return on sales shows, if company’s activity is profit- or loss-making, however, it doesn’t give an answer, how profitable are investments in this enterprise. To provide an answer to this question they calculate other ratios: return on assets and on equity.
See also: Solvency ratio of fertilizers and nitrogen compounds manufacturers