
Order a report
Custom-made industry research, company ratings, competitor analysis


Trends in the field of computer production
Information agency Credinform presents activity trends review of the largest companies in the production of computers, electronic and optical products.
The largest enterprises engaged in the production of computers and peripherals, communication and information protection devices, consumer electronics, measuring, testing, servicing, radar and medical equipment, optical devices, magnetic and optical information carriers, information and telecommunications systems and production of components in terms of annual revenue for the last reporting periods available in the state statistics bodies and the Federal Tax Service (2011 – 2020) were selected for this analysis (TOP 1000). The selection of companies and the analysis were carried out based on data from the Information and Analytical system Globas.
Net assets – is a ratio that reflects the real value of the company's property that is calculated annually as the difference between the assets on the company's balance sheet and its debt obligations. Net asset ratio is negative (insufficient property) if the company's debt exceeds the value of its property.
The largest company in the industry in terms of net assets is SAMSUNG ELECTRONICS RUS KALUGA LLC, INN 4025413896, Kaluga Region, production of television receivers, including video monitors and video projectors. In 2020, net assets of the company amounted to over 66 billion rubles.
TECHNOSERV AS LLC had the smallest amount of net assets in the TOP 1000, INN 7722286471, Moscow, production of computers and peripheral equipment. Property insufficiency in 2020 was expressed by a negative value of -9 billion rubles.
Covering the ten-year period, average net assets of the industry and their growth rates have a downward trend (Picture 1).
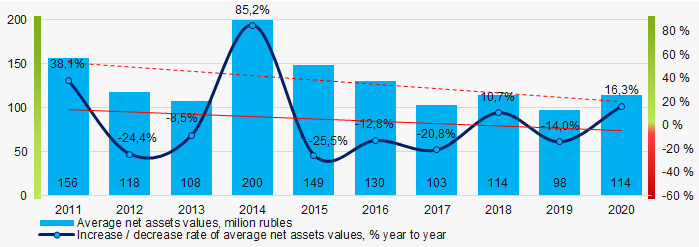 Picture 1. Change in average net assets values of the TOP 1000 in 2011-2020
Shares of companies with property insufficiency in the TOP 1000 had a positive downward trend over the past five years (Picture 2).
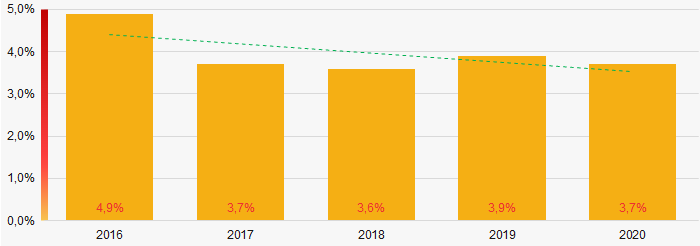 Picture 2. Shares of companies with negative net assets of the TOP 1000 in 2016-2020
Sales revenue
The revenue of the top ten companies in 2020 amounted to almost 39% of the total revenue of the TOP 1000 companies. (Picture 3). This indicates a high level of monopolization in the industry.
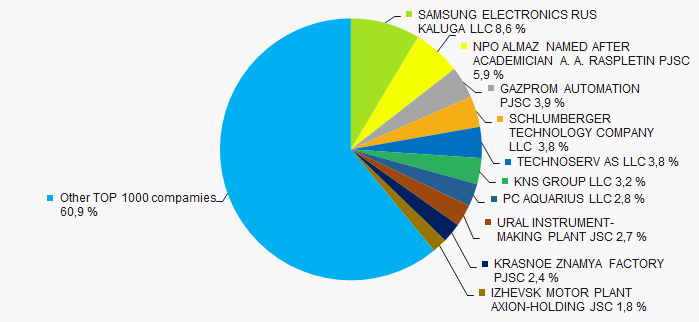 Picture 3. Shares of the TOP 10 companies in the total revenue of the TOP 1000 in 2019
In general, there is a trend in revenue and growth rates decreasing. (Picture 4).
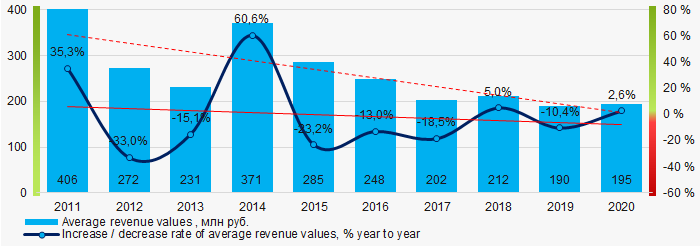 Picture 4. Changes in average revenue values in the industry in 2011-2020
Profit and loss
The largest company in the industry in terms of net profit in 2020 is SCHLUMBERGER TECHNOLOGY COMPANY LLC, INN 7709413265, Tyumen Region, production of other devices, sensors, equipment, measuring, controlling and testing tools. The profit of the company amounted to over 6 billion rubles.
Covering the ten-year period, average profit values in the industry tends to decrease with a stable growth rate about 11% per year on average. (Picture 5).
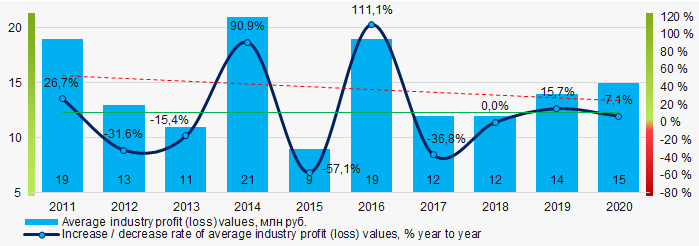 Picture 5. Change in average profit (loss) values of the TOP 1000 in 2011-2020
Covering the five-year period, average values of net profit of the TOP 1000 companies are increasing, while average net loss is also growing (Picture 6).
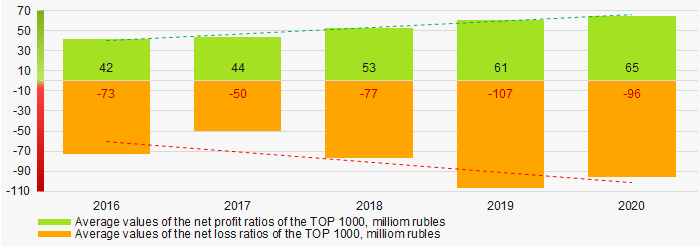 Picture 6. Changes in average values of the net profit and net loss ratios of the TOP 1000 companies in 2016-2020
Key financial ratios
Covering the ten-year period, total liquidity ratio average values were in the range of recommended values - from 1.0 to 2.0, with a trend to grow. (Picture 7).
Total liquidity ratio (current assets to short-term liabilities) shows sufficiency of a company’s assets to settle short-term liabilities.
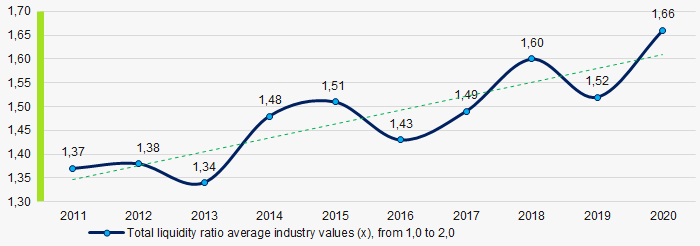 Picture 7. Changes in the total liquidity ratio average industry values in 2011-2020
For ten years period, investments profitability ratio average values showed a tendency to increase (Picture 8).
This ratio is calculated as the ratio of net profit to amount of equity and long-term liabilities and demonstrates return on equity capital involved in commercial activities and the long-term funds raised by the organization.
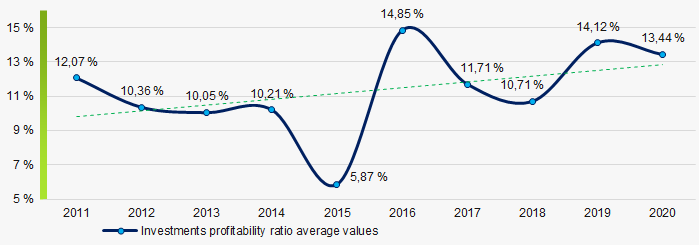 Picture 8. Changes in investments profitability ratio average values in 2011-2020
Asset turnover ratio is calculated as ratio of sales revenue to average value of total assets for a period and implicates the efficiency of use of all available resources, regardless of the sources they were raised. The ratio shows how many times per year the full cycle of production and turnover is performed generating corresponding effect in the form of profit.
Covering the ten years period, values of the said business activity ratio showed a trend to decrease (Picture 9).
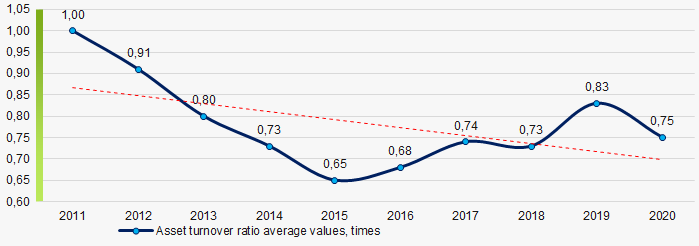 Picture 9. Changes in asset turnover ratio average values in 2011-2020
Small enterprises
83% of the TOP 1000 companies are registered in the Unified Register of Small and Medium-Sized Enterprises of the Federal Tax Service of the Russian Federation. At the same time, the share of their revenue in the total amount of the TOP 1000 in 2020 is 20%, which is the average value in the country in 2018-2019. (Picture 10).
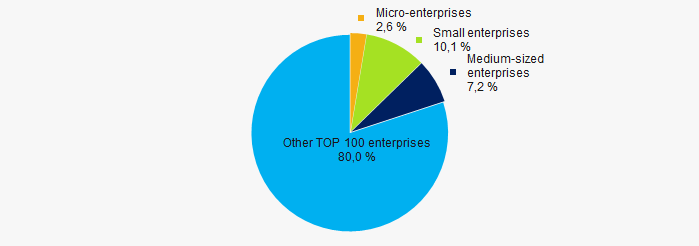 Picture 10. Revenue shares of small and medium-sized enterprises in the TOP-1000
Main regions of activity
The TOP 1000 companies are registered in 62 regions and are distributed unevenly across the country. Over 58% of the TOP 1000 companies' total revenue in 2020 is concentrated in Moscow, St. Petersburg and the Kaluga Region (Picture 11).
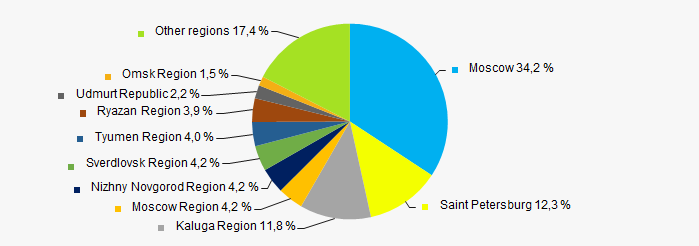 Picture 11. Distribution of the TOP 1000 companies' revenue by Russian regions
Financial position score
Financial position assessment of the TOP 1000 companies shows that the largest part of them is in financial position above average. (Picture 12).
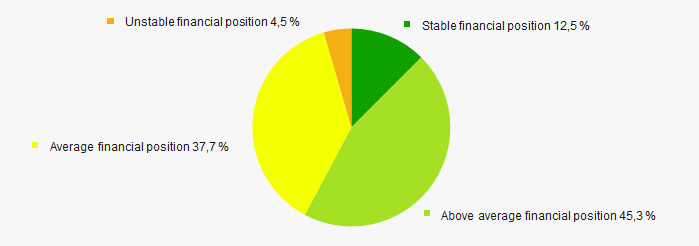 Picture 12. Distribution of the TOP 1000 companies by accounting report scoring
Globas Solvency Index
The vast majority of the TOP 1000 companies are assigned the highest and high Globas Solvency Index. This indicates their ability to repay their debt liabilities on time and fully (Picture 13).
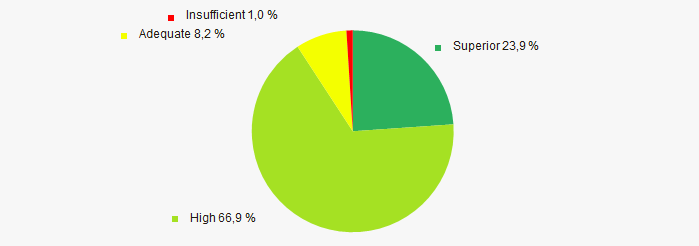 Picture 13. Distribution of the TOP 1000 companies according to the Globas Solvency Index
 Conclusion
The comprehensive assessment of activities of the largest companies in the field of computers, electronic and optical products manifacture that includes the main indexes, financial indicators and ratios shows predominance of negative trends in their activities in the period from 2015 to 2020. (Table 1).
| Trends and evaluation factors | Share of factor, % |
| Dynamics of average net assets values | |
| Increase (decline) rate in average size of net assets | |
| Enterprises' share increase / decrease with net assets negative values | |
| Level of equity concentration | |
| Dynamics of average revenue values | |
| Increase / decline rate in the average size of revenue | |
| Dynamics of the average profit (loss) | |
| Increase / decline rate in the average size of profit (loss) | |
| Increase / decline in average values of net profit | |
| Increase / decline in average values of net loss | |
| Increase / decrease in average values of total liquidity ratio | |
| Increase / decrease in average values of return on investment ratio | |
| Increase / decrease in average values of asset turnover ratio, times | |
| The share of small and medium-sized enterprises in revenue is more than 20% | |
| Regional concentration | |
| Financial position (the largest share) | |
| Globas Solvency Index (the largest share) | |
| Average value of factors share | |
<span st