
Order a report
Custom-made industry research, company ratings, competitor analysis


Equity turnover ratio of the largest Russian manufacturers of computers, electronic and optical products
Information agency Credinform offers a ranking of the largest Russian manufacturers of computers, electronic and optical products. The companies with the largest volume of annual revenue (TOP-10) were selected for the ranking, according to the data from the Statistical Register for the latest available periods (for 2016 and 2015). Then they were ranked by equity turnover ratio (Table 1). The analysis is based on data of the Information and Analytical system Globas.
Equity turnover ratio (times) is calculated as a relation of revenue to annual average sum of equity and demonstrates the company’s usage rate of all available assets.
Equity turnover ratio reflects the turnover rate of own capital. The high value of this indicator shows the effectiveness of use of own funds. Accordingly, low ratio value shows inaction of the part of own funds.
The experts of the Information agency Credinform, taking into account the actual situation both in the economy as a whole and in sectors, has developed and implemented in the Information and Analytical system Globas the calculation of practical values of financial ratios that can be recognized as normal for a particular industry. For manufacturers of computers, electronic and optical products the practical value of the equity turnover ratio was from 2,04 in 2016.
For getting of the most comprehensive and fair picture of the financial standing of an enterprise it is necessary to pay attention to all combination of indicators and financial ratios.
| Name, INN, region | Revenue, mln RUB | Net profit, mln RUB | Equity turnover ratio, times | Solvency index Globas | |||
| 2015 | 2016 | 2015 | 2016 | 2015 | 2016 | ||
| 1 | 2 | 3 | 4 | 5 | 6 | 7 | 8 |
| LLC PK AKVARIUS INN 7701256405 Moscow |
5 877,2 | 9 491,4 | 312,1 | 223,5 | 7,22 | 8,97 | 194 High |
| JSC GAZPROM AVTOMATIZATSIYA INN 7704028125 Moscow |
23 437,9 | 18 074,4 | 155,2 | 175,9 | 9,26 | 6,71 | 209 Strong |
| JSC KOMZ INN 1660004229 The Republic of Tatarstan |
4 225,3 | 9 314,6 | 500,4 | 1 512,0 | 9,13 | 6,33 | 157 Superior |
| JSC NITEL INN 5261001745 Nizhniy Novgorod region |
6 229,1 | 7 931,0 | 639,6 | 655,3 | 3,64 | 3,68 | 153 Superior |
| LLC Technological company SHLYUMBERZHE INN 7709413265 Tyumen region |
25 260,8 | 21 617,3 | 1 847,2 | -3 617,4 | 3,18 | 3,06 | 246 Strong |
| JSC Arzamas instrument-making plant named after Landin INN 5243001742 Nizhniy Novgorod region |
6 858,9 | 9 182,0 | 349,4 | 394,2 | 2,49 | 3,00 | 185 High |
| JSC PLANT KRASNOYE ZNAMYA INN 6229004711 Ryazan region |
7 780,2 | 8 713,4 | 784,6 | 806,9 | 2,89 | 2,34 | 205 Strong |
| JSC Kaluga-based instrument making plant TYPHOON INN 4026005699 Kaluga region |
3 829,3 | 7 928,2 | 531,7 | 468,4 | 1,10 | 2,01 | 199 High |
| LLC SAMSUNG ELECTRONICS RUS KALUGA INN 4025413896 Kaluga region |
45 112,0 | 47 654,9 | 2 740,2 | 6 363,7 | 1,50 | 1,37 | 197 High |
| LLC VLV INN 3906123832 Kaliningrad region |
3 725,6 | 6 865,2 | -8,6 | -17,1 | -718,33 | -380,45 | 331 Adequate |
| Total for TOP-10 companies | 132 336,4 | 146 772,4 | 7 851,9 | 6 965,5 | |||
| verage industrial value for TOP-10 companies | 13 233,6 | 14 677,2 | 785,2 | 696,5 | -67,79 | -34,30 | |
| Average industrial value | 284,6 | 226,0 | 9,0 | 18,2 | 2,19 | 2,04 | |
The average indicator of the equity turnover ratio of TOP-10 companies in 2016 is below the average industrial value. Four from TOP-10 enterprises have increased in 2015 — 2016 the indicators of revenue and net profit compared to the previous period (marked with green color in columns 2 — 5 of the Table 1). Other companies either have decreased their indicators of profit or have got loss (marked with red filling in columns 2 — 5 of the Table 1).
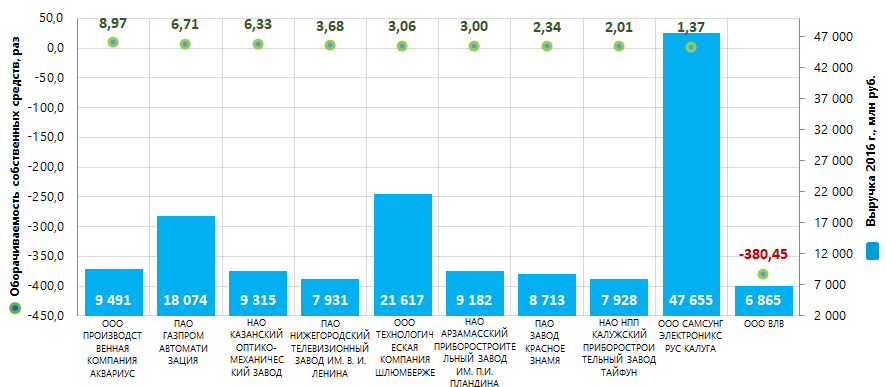 Picture 1. Equity turnover ratio and revenue of the largest Russian manufacturers of computers, electronic and optical products (TOP-10)
The industry average values of the equity turnover ratio were above the practical value of 2016 with decreasing tendency over the past ten years (Picture 2).
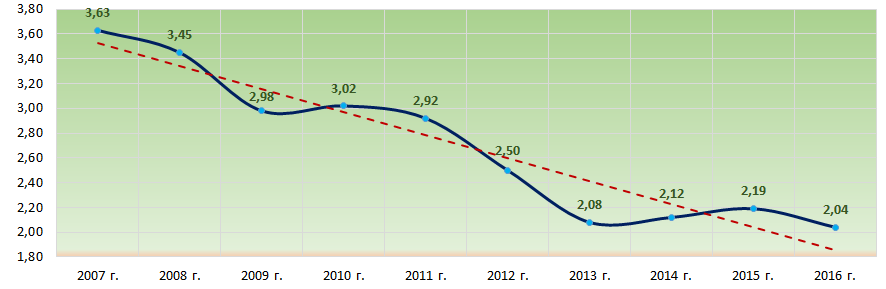 Picture 2. Change in the average industry values of the equity turnover ratio of largest Russian manufacturers of computers, electronic and optical products (in 2007 — 2016)
Nine out of TOP-10 companies have got from strong to superior solvency index Globas , that demonstrates their ability to repay their debt obligations in time and fully.
LLC VLV has got adequate solvency index Globas, because of loss andnon-compliance of indicators of liquidity and financial stability to normal recommended values. The forecast for index development is stable.