Order a report
Custom-made industry research, company ratings, competitor analysis


Return on investments of companies for construction of residential and non-residential buildings
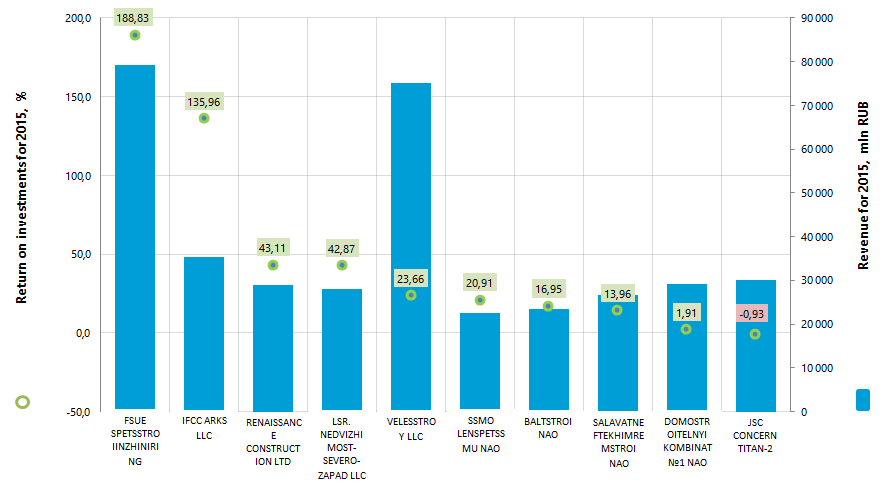
Information agency Credinform represents the ranking of Russian companies for construction of residential and non-residential buildings. The enterprises with the largest volume of revenue (TOP-10) were selected for the ranking, according to the data from the Statistical Register for the latest available periods (for 2014 and 2015). Then they were ranked by return on investments in 2015 (Table 1).
Return on investments (%) is calculated as a ratio of net profit (loss) to the value of net assets. The indicator characterizes the level of profitability from each ruble received from investments, i.e. the amount of monetary units required by an enterprise for receiving one monetary unit of net profit. With the help of this indicator it is possible to assess the advisability of raising of borrowed funds at a certain percent.
Normative values for profitability indicators are not provided, because they vary depending on the industry, in which an enterprise operates. The indicators of each particular company should be considered in comparison with industry indicators.
For getting of the most comprehensive and fair picture of the financial standing of an enterprise it is necessary to pay attention to all combination of company’s financial indicators and ratios.
| Name, INN, rgion | Net profit for 2015, mln RUB | Revenue for 2015, mln RUB | Revenue for 2015 by 2014, % | Return on investments, 2015 г., % | Solvency index Globas-i® |
|---|---|---|---|---|---|
| FSUE SPETSSTROIINZHINIRING PRI FEDERALNOM AGENTSTVE SPETSIALNOGO STROITELSTVA INN 5047054473 Moscow |
-5 062,4 | 79 248,8 | 10 | 188,83 | 273 High |
| INVESTMENTS AND FINANCES CONSTRUCTION COMPANY ARKS (IFCC ARKS) LLC INN 7714275324 Moscow |
1 088,5 | 35 346,3 | 9 | 135,96 | 245 High |
| RENAISSANCE CONSTRUCTION LTD INN 7708185129 Moscow |
826,2 | 28 970,9 | -37 | 43,11 | 212 High |
| LSR. NEDVIZHIMOST-SEVERO-ZAPAD LLC INN 7826090547 Saint-Petersburg |
6 864,6 | 27 937,3 | 199 | 42,87 | 185 The highest |
| VELESSTROY LLC INN 7709787790 Moscow |
1 088,5 | 75 051,2 | 49 | 23,66 | 238 High |
| SSMO LENSPETSSMU NAO INN 7802084569 Saint-Petersburg |
6 284,5 | 22 453,7 | 3 | 20,91 | 174 The highest |
| BALTSTROI NAO INN 7804079525 Saint-Petersburg |
177,1 | 23 379,2 | 16 | 16,95 | 242 High |
| SALAVATNEFTEKHIMREMSTROI NAO INN 0266012678 Republic of Bashkortostan |
180,1 | 26 725,0 | 16 | 13,96 | 234 High |
| DOMOSTROITELNYI KOMBINAT №1 NAO INN 7714046959 Moscow |
191,8 | 29 107,3 | -25 | 1,91 | 254 High |
| JSC CONCERN TITAN-2 INN 7827004484 Leningrad region |
-14,2 | 29 998,9 | 60 | -0,93 | 259 High |
| Total in the group of TOP-10 companies (* - group average value) |
11 624,6 | 378 218,5 | *14 | *48,72 | |
| Total in the group of TOP-100 companies ((* - group average value) |
43 003,0 | 1 099 561,1 | *18 | *119,88 | |
| Industry average value | -0,7 | 50,7 | -12 | -12,00 |
The average values of the return on investments in 2015 as well in the group of TOP-10, as in the group TOP-100 companies are significantly higher than the industry average. At the same time, JSC CONCERN TITAN-2 has a negative value of the indicator.
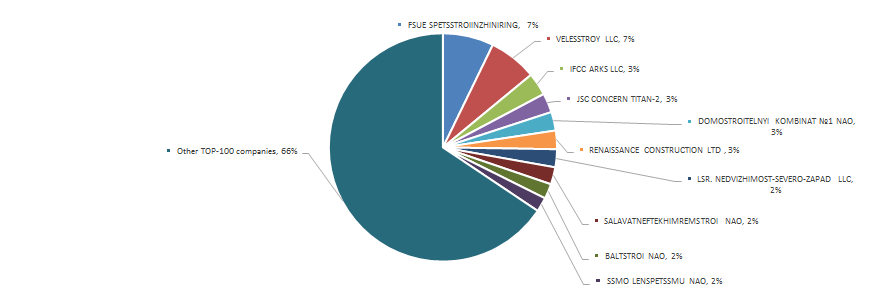
The volume of revenue of 10 the largest companies made 34% of the total revenue of 100 the largest enterprises in 2015. It points to a relatively high level of competition in the industry. The largest company in terms of volume of revenue was FSUE SPETSSTROIINZHINIRING PRI FEDERALNOM AGENTSTVE SPETSIALNOGO STROITELSTVA (Picture 2).
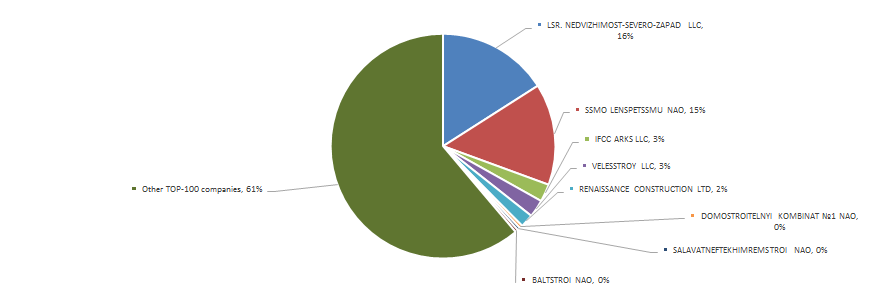
The total volume of profit of 10 the largest companies was 39% of the total revenue of 100 the largest enterprises in 2015. The largest company in terms of the profit volume was LSR. NEDVIZHIMOST-SEVERO-ZAPAD LLC (Picture 3).
All TOP-10 companies got the highest or high solvency index Globas-i®, that points to their ability to repay their debts in time and fully.
Seven from TOP-10 companies reduced indicators of revenue in 2015 compared to the previous period or had a loss (are marked with red filling in Table 1).
In the group of TOP-100 companies there were 8 unprofitable companies in 2014, and in 2015 their number decreased to 12. At the same time, the profit volume grew by 18% in 2015.
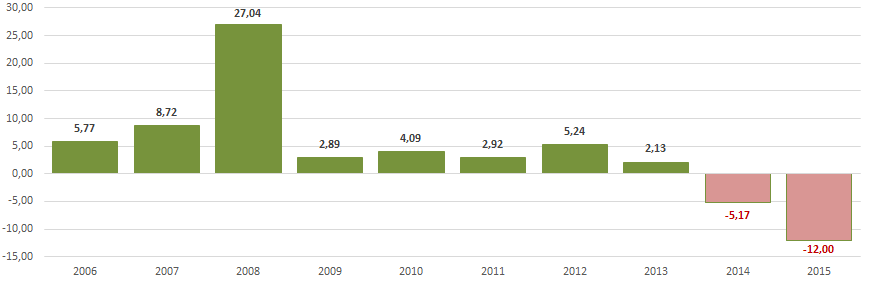
Indicators of the return on investments in the dynamics of Russian companies for the construction of residential and non-residential buildings testify to an unsuccessful state of business in terms of investment activity in the industry in recent years (Picture 4).
As a whole the indicators of the industry of construction of residential and non-residential buildings in monetary terms have been growing have been increasing at an ever-increasing rates it the last few years, that is confirmed by the data of the Federal State Statistics Service (Picture 5 and Table 2).
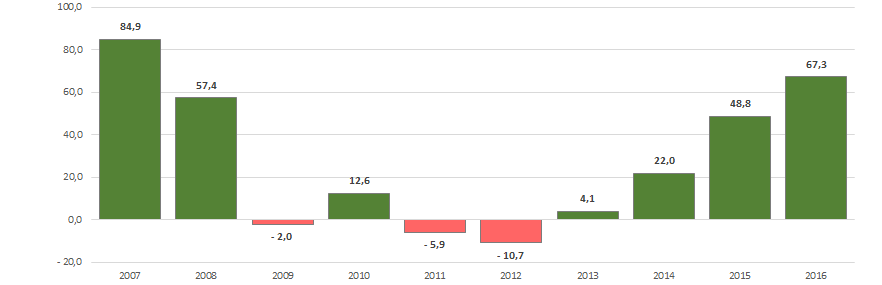
In the period from 2006 to 2016 the greatest volume of buildings construction was observed in 2016, the smallest - in 2006. (Table 2).
| 2006 | 2007 | 2008 | 2009 | 2010 | 2011 | 2012 | 2013 | 2014 | 2015 | 2016 |
|---|---|---|---|---|---|---|---|---|---|---|
| 7 938,1 | 14 682,0 | 35 113,9 | 34 421,5 | 38 768,8 | 36 463,9 | 32 566,9 | 33 896,5 | 41 366,7 | 61 546,6 | 102 957,7 |
| *) In Table 2 the slowdown in volumes is marked with a red filling, with a green filling – the growth (year-on-year). | ||||||||||
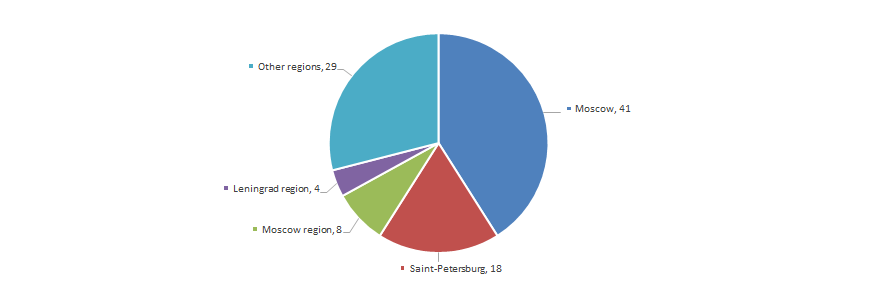
Companies for the construction of residential and non-residential buildings are distributed unevenly throughout the country. Their maximum concentration is observed in the metropolitan areas with the largest population and the concentration of financial resources in the country. This is confirmed by the information of the Information and Analytical system Globas-i®, according to which 100 the largest companies in terms of revenue for 2015 are registered in 26 regions of Russia (Picture 6).