
Order a report
Custom-made industry research, company ratings, competitor analysis


Passenger transport companies in Saint Petersburg
In April 2022, launch of the new model of transportation services is planned in Saint Petersburg. Assets turnover ratio analyses allows to rate accurately effectiveness of the business activity of the companies and shows it’s relatively high but decreasing level among the surface transport companies in Saint Petersburg in 2019 – 2020 with decreasing profit and increasing loss.
For this ranking Information Agency Credinform selected in Globas the largest companies in Saint Petersburg (TOP 10) in terms of annual revenue for the last reporting periods available in the state statistics bodies and the Federal Tax Service (2018 - 2020) that provide passenger bus, trolleybus and tramway transportation. Then these companies were ranked by assets turnover ratio (Table 1).
period. It characterizes efficiency of company's use of all available resources, regardless of sources they were raised. The ratio shows how many times per year the full cycle of production and circulation is performed, generating the corresponding effect in the form of profit.
External factors include company’s type and industry, size of enterprise. Macroeconomic situation also largely affects company’s assets turnover. Severance of ties with other organizations and inflation development cause stock building, which severely slows down the assets turnover.
Internal factors are price policy, asset profile and inventory valuation system.
It is necessary to pay attention to the entire set of indicators and financial ratios to get the most complete and objective picture of enterprise's financial condition.
| Name, INN, types of activity | Revenue, million rubles | Net profit (loss), million rubles | Asset turnover, times | Globas Solvency Index | |||
| 2019 | 2020 | 2019 | 2020 | 2019 | 2020 | ||
| 1 | 2 | 3 | 4 | 5 | 6 | 7 | 8 |
| Comtrade INN 7841399812 Scheduled passenger bus transport |
|
|
|
|
|
|
219 Strong |
| IBF-Nord Company Limited INN 7804328651 Scheduled passenger bus transport |
|
|
|
|
|
|
284 Medium |
| BUS-EXPRESS CO. LTD INN 7816465733 Scheduled passenger bus transport |
|
|
|
|
|
|
177 High |
| ATP BARS 2 INN 4703086802 Scheduled passenger bus transport |
|
|
|
|
|
|
263 Medium |
| AO TRETII PARK INN 7814010096 Scheduled passenger bus transport |
|
|
|
|
|
|
229 Strong |
| SHPUNT-SEVERO-ZAPAD INN 7805472231 Scheduled passenger bus transport |
|
|
|
|
|
|
285 Medium |
| SPB GUP PASSAZHIRAVTOTRANS INN 7830001758 Scheduled passenger bus transport |
|
|
|
|
|
|
234 Strong |
| SPB GUP GORELEKTROTRANS INN 7830001927 Scheduled passenger tramway and trolleybus transport |
|
|
|
|
|
|
249 Strong |
| PALMIRA COMPANY LIMITED INN 7806345155 Scheduled passenger bus transport |
|
|
|
|
|
|
277 Medium |
| LIMITED LIABILITY COMPANY TRANSPORT CONCESSION COMPANY INN 6952036026 Scheduled passenger tramway transport |
|
|
|
|
|
|
256 Medium |
| TOP 10 average value | |
|
|
|
|
|
|
| The industry average value (Scheduled passenger conveyance by public surface transport) | |
|
|
|
|
|
|
![]() Improvement of the indicator to the previous period,
Improvement of the indicator to the previous period, ![]() deterioration of the indicator to the previous period
deterioration of the indicator to the previous period
In 2020, average values of assets turnover of TOP 10 were above the industry average. There was a decline in values among eight companies out of TOP 10, while in 2019 there were six companies like this.
In 2020, two companies out of ten increased revenue and three companies increased net profit. However average revenue in TOP 10 decreased by 1%, industry average value declined by 17%. Average loss in TOP 10 increased more than four times and industry average loss increased more than three times.
For the last five years industry average values of assets turnover ratio have been growing for only one period. The indicator reached the best values in 2017, and the worst result was shown in 2020. (Picture 1)
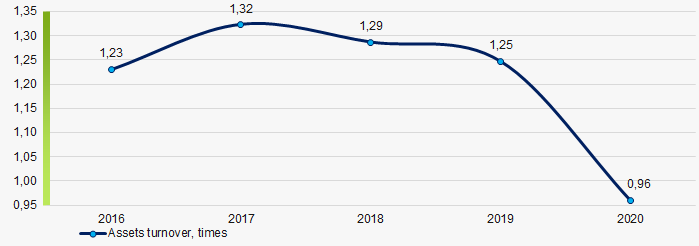 Picture 1. Change in industry average values of assets turnover of surface transport companies in 2016 – 2020