Globas 2020 highlights
Dear Users!
Following the tradition, we sum up the results of 2020 and share our plans.
The Year of Entrepreneurship in Russia was to be held in 2020. Ironically, the business has faced many difficulties that affected the development of the enterprises and economy in general. That is why relevant and up-to-date information is especially valuable today.
In 2020, we have improved the tools in Globas and added sources to help in identification of new risks and doing business in a rapidly changing environment.
We have increased information support: hold about 100 webinars on current issues, organized corporate training, advised on questions arose during the counterparties check.
We would like to thank you for your confidence and interest in our product. Heeding your valuable advices and recommendations, we develop Globas to be better and friendlier for you!
According to the experts of RAEX-Analytics rating agency, Globas takes the lead in the first Russian rating of information and analytical systems.
NEW TOOLS AND FUNCTIONS
- Globas app
- Company’s position in the industry – fully updated section
- New tools for Lists
- Tax burden and assessment of the field tax inspection probability
- Risk assessment for sole entrepreneurs
- Profile of a natural person with extended checking capabilities, new types of extractions on self-employment, search by enforcement proceedings and suspicion of committing a crime
- Successors/Predecessors – new section of the report
- Interactive analysis in all sections of Globas
- Signs requiring attention in all sections of the report
- Even more accurate risk assessment - improving the Globas indices
- Arbitration proceedings – improving data, including of counter-claims
- Selection for transfer pricing.
It takes two steps using pre-installed criteria customization template to make a selection of comparable companies that meet the requirements of the Tax Code of Russia by interrelationship, net assets, losses and financial indicators.
NEW DATA
In 2020, new data have been added to Globas: job vacancies, audit reports, explanatory notes on the financial statements and corporate action notifications for listed companies.
Analysis of procurements is added with commercial tenders organized by for-profit companies or Sole Entrepreneurs by their own rules and using their own funds. New data makes it possible to monitor the companies’ activity and better assess the market opportunities.
Globas has all tools and functions for a fast and proper analysis of business partners. In 2021, we will continue to improve tools and functions and add new sources: our plans involve changes in express assessment taking into account new sources, enhancement of analytical tools, update of a company’s report structure and many other improvements for more efficient and comfortable use of Globas.
Information agency Credinform wishes you a Happy New Year 2021! May your important and not easy work be rewarded with new perspectives and opportunities in the forthcoming year!
We wish you well-being, health and success!
QR Code for Globas download in App Store and Google Play.
| App Store | Google Play | |
 |
 |
Use your login and password to enter the application.
Return on sales of the largest retailers
Information agency Credinform represents a ranking of the largest Russian food retailers. Companies of “Perekrestok, “Pyaterochka”, “Karusel”, “Lenta” and “Magnit” chains with the largest volume of annual revenue were selected for the ranking, according to the data from the State statistical authorities and the Federal Tax Service for the latest available periods (2017 - 2019). The companies were ranked by return on sales ratio (Table 1). The analysis was based on the data of the Information and Analytical system Globas.
Return on sales (%) is calculated as the share of operating profit in the total sales of the company. The ratio shows the efficiency of the production and commercial activities of the company, as well as the share of funds received from sale of products after covering its cost, taxes and interest on loans.
The range of values of the ratio for companies of the same industry is determined by differences in competitive strategies and product groups.
For the most complete and objective view of the financial condition of the enterprise, it is necessary to pay attention to the complex of indicators and financial ratios of the company.
| Name, INN, region | Revenue, million RUB | Net profit (loss), million RUB | Return on sales, % | Solvency index Globas | |||
| 2018 | 2019 | 2018 | 2019 | 2018 | 2019 | ||
| 1 | 2 | 3 | 4 | 5 | 6 | 7 | 8 |
| LLC AGROASPEKT INN 7715277300 Moscow |
 97 797 97 797 |
 100 955 100 955 |
 -16 464 -16 464 |
 5 402 5 402 |
 8,59 8,59 |
 6,76 6,76 |
208 Strong |
| LLC SELTA INN 2310053662 Krasnodar territory |
 38 531 38 531 |
 38 996 38 996 |
 1 935 1 935 |
 1 896 1 896 |
 7,20 7,20 |
 6,09 6,09 |
200 Strong |
| LLC AGRO-AUTO INN 7714211088 Moscow region |
 22 638 22 638 |
 26 538 26 538 |
 -3 156 -3 156 |
 299 299 |
 3,96 3,96 |
 5,37 5,37 |
222 Strong |
| LLC AGROTORG INN 7825706086 Saint Petersburg |
 1035979 1035979 |
 1 234 350 1 234 350 |
 10 128 10 128 |
 7 206 7 206 |
 5,77 5,77 |
 4,55 4,55 |
239 Strong |
| LLC LENTA INN 7814148471 Saint Petersburg |
 438 812 438 812 |
 445 021 445 021 |
 5 140 5 140 |
 9 146 9 146 |
 3,87 3,87 |
 4,39 4,39 |
242 Strong |
| LLC KOPEYKA-MOSCOW INN 7715196234 Moscow |
 57 587 57 587 |
 60 613 60 613 |
 1 405 1 405 |
 -1 153 -1 153 |
 3,22 3,22 |
 2,98 2,98 |
293 Medium |
| JSC TRADING HOUSE PEREKRESTOK INN 7728029110 Moscow |
 878 818 878 818 |
 906 694 906 694 |
 5 980 5 980 |
 21 698 21 698 |
 2,26 2,26 |
 2,79 2,79 |
234 Strong |
| LLC SLADKAYA ZHIZN N.N. INN 5257041777 Nizhniy Novgorod region |
 60 482 60 482 |
 79 021 79 021 |
 -753 -753 |
 -712 -712 |
 -1,33 -1,33 |
 -0,30 -0,30 |
303 Adequate |
| JSC TANDER INN 2310031475 Krasnodar territory |
 1280930 1280930 |
 1 396 525 1 396 525 |
 23 377 23 377 |
 12 985 12 985 |
 -0,70 -0,70 |
 -1,58 -1,58 |
240 Strong |
| LLC X 5 GIPER INN 7710529680 Moscow |
 38 259 38 259 |
 53 514 53 514 |
 451 451 |
 7 840 7 840 |
 -1,20 -1,20 |
 -2,09 -2,09 |
200 Strong |
| Average value for TOP-10 |  394 983 394 983 |
 434 223 434 223 |
 2 804 2 804 |
 6 461 6 461 |
 3,16 3,16 |
 2,90 2,90 |
|
| Average value for TOP-50 |  83 880 83 880 |
 89 003 89 003 |
 1 342 1 342 |
 2 449 2 449 |
 13,09 13,09 |
 7,86 7,86 |
|
 growth of indicator to the previous period,
  decrease of indicator to the previous period
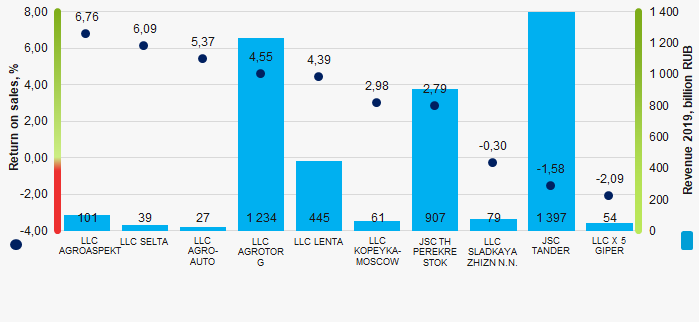
The average indicator of the return on sales ratio of TOP-10 is below the average one of TOP-50. In 2019, four companies have increased the value compared to the previous period.
 Picture 1. Return on sales of companies included in the largest food chains (TOP-10)
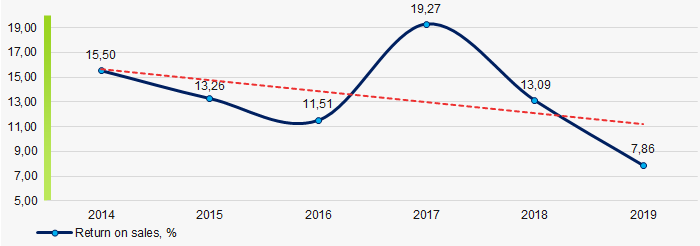
During six years, the average values of the return on sales ratio of TOP-50 have a trend to decrease (Picture 2).
 Picture 2. Change in the average values of the return on sales ratio of TOP-50 companies included in the largest Russian food chains, 2014 - 2019