Order a report
Custom-made industry research, company ratings, competitor analysis


The largest Russian manufacturers of thermal power on the current assets to equity ratio
Information agency Credinform offers the ranking of the largest Russian manufacturers of thermal power. The companies with the highest volume of revenue involved in this industry (TOP-10) were selected for this ranking, according to the data from the Statistical Register for the latest available period (for 2015-2014). Then they were ranked by current assets to equity ratio (Table 1).
Current assets to equity ratio (х) characterizes company’s ability to maintain the level of own working capital and to finance current assets with own sources. The ratio is calculated as the relation of own current assets of a company to total value of equity. The recommended value is from 0,2 to 0,5.
Decrease in the ratio points to a possible slowdown in collection of receivables or tightening of conditions for granting trade credit from suppliers and contractors. The increase demonstrates the growing opportunities to pay off current liabilities.
The specialists of the Information agency Credinform, taking into account the actual situation in the economy as well in general as in industries, have developed and implemented in the Information and Analytical system Globas-i® the calculation of practical values of financial ratios, which may be considered as normal for a specific industry. For manufacturers of thermal power the practical value of the current assets to equity ratio ranges from 0,31 to 1.
For getting of the most comprehensive and fair picture of the financial standing of an enterprise it is necessary to pay attention not only to compliance with standard values, but also to all combination of financial indicators and company’s ratios.
| Name, INN, region | Net profit for 2015, mln RUB | Revenue for 2015, mln RUB | Revenue for 2015 by 2014, +/- % | Current assets to equity ratio, (х) | Solvency index Globas-i® |
|---|---|---|---|---|---|
| VOLGOGRADSKOE KOMMUNALNOE KHOZYAISTVO MUE INN 3448004130 Volgograd region |
-932,1 | 5 561,1 | 2 | 1,91 | 321 Satisfactory |
| MURMANENERGOSBYT NJSC INN 5190907139 Murmansk region |
-131,1 | 7 655,9 | 6 | 0,84 | 301 Satisfactory |
| TOPLIVNO-ENERGETICHESKII KOMPLEKS SANKT-PETERBURGA SUE INN 7830001028 Saint-Petersburg |
-287,8 | 26 508,5 | 4 | -0,17 | 255 High |
| OMSKIE RASPREDELITELNYE TEPLOVYE SETI NJSC INN 5503249258 Omsk region |
143,6 | 7 668,4 | 2 350 | -0,20 | 266 High |
| JSC MOSCOW INTEGRATED POWER COMPANY INN 7720518494 Moscow |
-497,9 | 106 813,7 | -2 | -0,24 | 259 High |
| JSC TGC-2 INN 7606053324 Yaroslavl region |
-1 430,6 | 31 038,1 | 3 | -1,37 | 306 Satisfactory |
| JSC URAL DISTRICT HEATING COMPANY INN 7203203418 Tyumen region |
-118,0 | 10 592,8 | 11 | -1,64 | 272 High |
| JSC Autonomous heat energy company INN 2312054894 Krasnodar territory |
127,4 | 5 910,4 | 9 | -2,30 | 234 High |
| TEPLOENERGO PJSC INN 5257087027 Nizhny Novgorod region |
73,1 | 9 480,5 | 4 | -4,54 | 223 High |
| PETERBURGTEPLOENERGO LLC INN 7838024362 Saint-Petersburg |
35,7 | 5 189,8 | -2 | -18,46 | 245 High |
| Total on the group of TOP-10 companies | -3 017,7 | 216 419,3 | 5* | -2,62* | |
| Total on the group of TOP-100 companies | -20 718,2 | 348 839,7 | 8* | -1,04** |
*) - the average value on the group of companies
**) – the average value on the industry
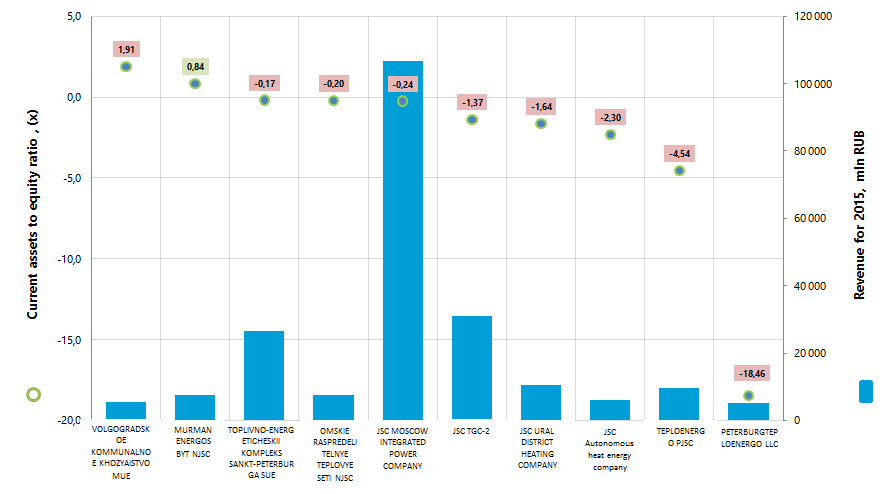
The average value of the current assets to equity ratio in the group of TOP-10 companies in 2015 is negative and lower than the industry average. At the same time, none from TOP-10 companies has indicators that meet the standard value. Only the ratio value of MURMANENERGOSBYT NAO is in the range of practical value.
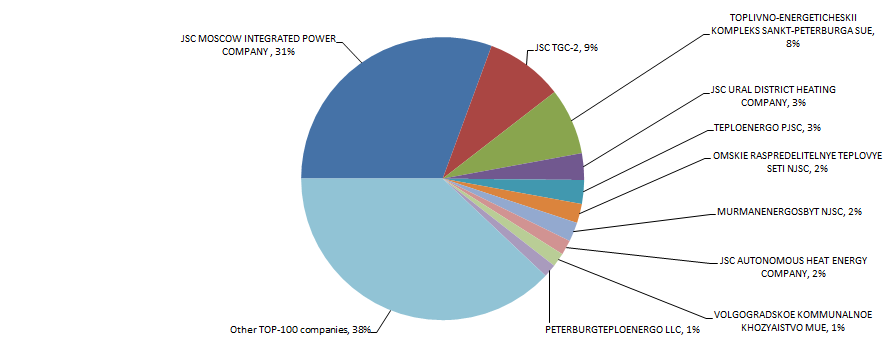
The volume of revenue of 10 the largest enterprises is 62% of the total revenue of 100 the largest companies. It testifies to a relatively high level of monopolization in this industry, taking into account that organizations of this industry work exclusively at the regional level. The share of the enterprise, being the largest on revenue in 2015, JSC MOSCOW INTEGRATED POWER COMPANY, made 31% in the total revenue of the group of TOP-100 companies (Picture 2).
Seven from TOP-10 companies have got high solvency index Globas-i®, that testifies to their ability to pay off their debts in time and fully.
Three from TOP-10 companies have got satisfactory solvency index Globas-i®. Thus, regarding VOLGOGRADSKOE KOMMUNALNOE KHOZYAISTVO MUE, MURMANENERGOSBYT NAO, JSC TGC-2 there is information about their participation as defendants in arbitration court proceedings in terms of debt collection. The same companies have unclosed enforcement orders and loss in the structure of balance sheet ratios. Forecast of the ratio development of all three companies is stable.
From TOP-10 companies only OMSKIE RASPREDELITELNYE TEPLOVYE SETI NAO and TEPLOENERGO PJSC were able to increase the net profit and revenue in 2015 compared to the previous period. The rest enterprises (marked with red background shading in Table 1) have reduced the volumes of revenue or net profit, or have a loss.
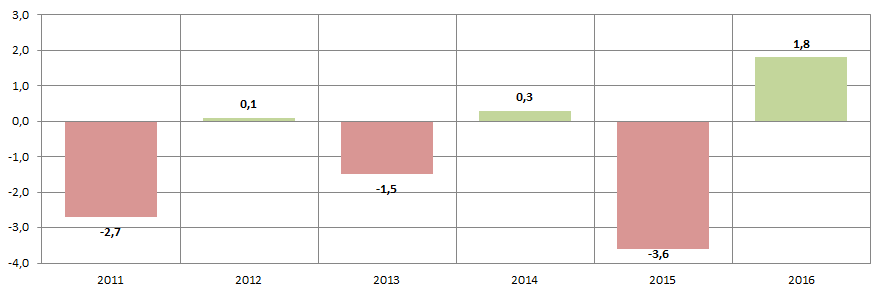
In general, the indicators of thermal power manufacture in real terms in the period from 2010 to 2016 have not differed in stability, that is confirmed by the data of the Federal State Statistics Service (Table 2).
| 2010 | 2011 | 2012 | 2013 | 2014 | 2015 | 2016 | Share in the total volume of supplied thermal power in 2016, % | |
|---|---|---|---|---|---|---|---|---|
| Thermal power | 1 346 710 | 1 310 275 | 1 312 198 | 1 292 534 | 1 296 979 | 1 250 479 | 1 272 839 | 100,0 |
| Thermal power supplied by nuclear power plants | 3 962 | 3 556 | 3 598 | 3 527 | 3 517 | 3 398 | 3 505 | 0,3 |
| Thermal power supplied by boiler-house plants | 649 922 | 624 869 | 624 991 | 622 450 | 622 733 | 595 373 | 590 323 | 46,4 |
| Thermal power supplied by industrial disposal plants | 74 491 | 77 169 | 77 848 | 75 484 | 74 705 | 78 935 | 86 040 | 6,8 |
| Thermal power supplied by other power plant units | 1 904 | 2 027 | 2 062 | 2 702 | 2 790 | 3 284 | 4 072 | 0,3 |
| Thermal power supplied by thermal power plants | 611 276 | 599 082 | 600 150 | 585 089 | 590 112 | 566 413 | 586 405 | 46,1 |
| Thermal power supplied by electric boilers | 4 622 | 3 388 | 3 369 | 3 101 | 2 949 | 3 017 | 2 494 | 0,1 |
*) red background shading in Table 2 marked decline in production, green – the growth.
The greatest volume of thermal power is manufactured by boiler-house and thermal power plants. In 2016, in general, there is an increased production (Picture 3).
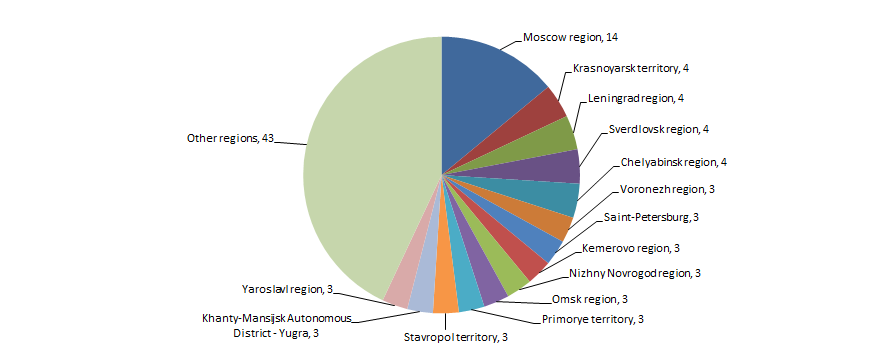
The enterprises on thermal power manufacture are distributed across the country’s territory relatively equal, taking into account the specifics of their activity, and are concentrated mainly in the industrially developed regions with a significant amount of the population. It is confirmed by the data of the Information and Analytical system Globas-i, according to which 100 the largest companies of the industry in terms of revenue for 2015 are registered in 46 regions of Russia (Picture 4).