
Order a report
Custom-made industry research, company ratings, competitor analysis


Liabilities and assets in construction
Information agency Credinform represents a ranking of the largest construction companies having a potential opportunity to carry out a tax monitoring. The companies engaged in construction of buildings and structures meeting the new criteria for tax monitoring with the largest volume of annual revenue (TOP-10 and TOP-100) were selected for the ranking, according to the data from the Statistical Register and the Federal Tax Service for the latest available periods (2017 - 2019). They were ranked by the ratio of assets and liabilities (Table 1). The selection and analysis was based on the data of the Information and Analytical system Globas.
Liabilities to assets ratio shows the share of assets financed by loans. The standard value for this ratio is from 0.2 to 0.5
Sales revenue and net profit show the scale of the company and the efficiency of its business, and the ratio of liabilities and assets indicates the risk of insolvency of the company.
Exceeding the upper standard value indicates excessive debt load, which can stimulate development, but negatively affects the stability of the financial position. If the value is below the standard value, this may indicate a conservative strategy of financial management and excessive caution in attracting new borrowed funds.
In order to get the most comprehensive and fair picture of the financial standing of an enterprise it is necessary to pay attention to all combination of indicators and financial ratios.
| Name, INN, region | Revenue, million RUB | Net profit (loss), million RUB | Ratio of liabilities and assets (x), from 0,2 to 0,5 | Solvency index Globas | |||
| 2018 | 2019 | 2018 | 2019 | 2018 | 2019 | ||
| 1 | 2 | 3 | 4 | 5 | 6 | 7 | 8 |
| MONARCH INN 7714950480 Moscow |
 18 910 18 910 |
 17 436 17 436 |
127 |
116 |
0,95 |
0,98 |
233 Strong |
| OOO MIP-STROI #1 INN 7701394860 Moscow |
56 995 |
53 932 |
10 |
99 |
0,98 |
0,98 |
272 Medium |
| JSC PIK-Industries INN 7729755852 Moscow |
26 948 |
44 616 |
1 792 |
1 263 |
1,01 |
0,98 |
275 Medium |
| RENAISSANCE HEAVY INDUSTRIES LLC INN 7802772445 Moscow |
37 662 |
42 884 |
4 732 |
2 079 |
0,83 |
0,94 |
245 Strong |
| Fodd INN 7729355935 Moscow |
19 640 |
23 853 |
262 |
314 |
0,97 |
0,92 |
176 High |
| JSC VOSTOKNEFTEZAVODMONTAZH INN 0277015293 Republic of Bashkortostan |
11 047 |
18 231 |
82 |
405 |
0,89 |
0,88 |
208 Strong |
| PIK GROUP INN 7713011336 Moscow |
25 343 |
24 572 |
15 137 |
306 |
0,74 |
0,75 |
233 Strong |
| RENAISSANCE CONSTRUCTION LTD INN 7708185129 Moscow |
44 512 |
25 720 |
1 290 |
2 676 |
0,94 |
0,74 |
201 Strong |
| OOO ENERGO-STROI INN 7801174139 Saint Petersburg |
8 713 |
24 118 |
229 |
1 640 |
0,92 |
0,74 |
171 Superior |
| LENSPETSSMU INN 7802084569 Saint Petersburg |
15 270 |
17 182 |
4 374 |
6 441 |
0,68 |
0,71 |
217 Strong |
| Average value for TOP-10 | 26 504 |
29 254 |
2 804 |
1 534 |
0,89 |
0,86 |
|
| Average value for TOP-100 | 8 802 |
7 789 |
30 |
-289 |
0,81 |
0,81 |
|
growth of indicator to the previous period, decrease of indicator to the previous period
The average indicator of the ratio of liabilities and assets of TOP-10 and TOP-100 is above the standard value. Indicators of six companies show the positive dynamic to move toward the standard value in 2019.
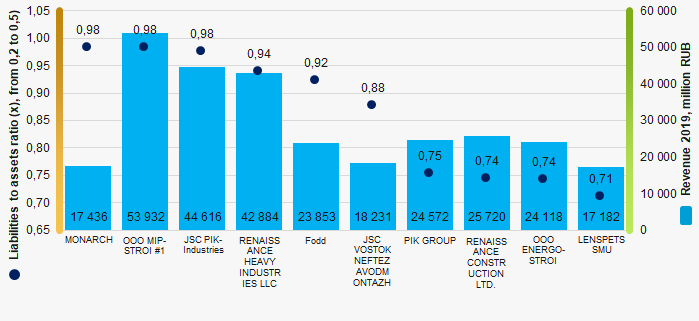 Picture 1. Ratio of liabilities and assets, and revenue of the largest construction companies (TOP-10)
Over the past 6 years, the industry average values of the ratio of liabilities and assets of TOP-100 have a positive trend to move toward the standard value (Picture 2).
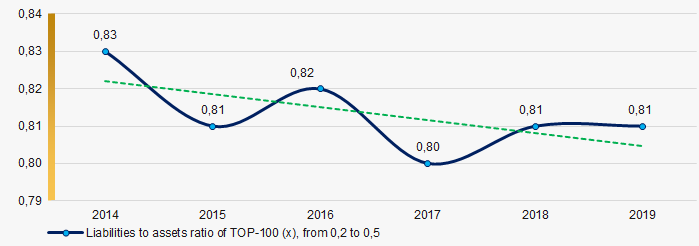 Picture 2. Change in the industry average values of the ratio of liabilities and assets of the TOP-100 largest construction companies in 2014 – 2019