The procedure for execution of the state defense order is specified
The Federal Law of July 3, 2016 №317-FL "About modification of the Federal law "About the State Defense Order" and article 7.29.2 of the Code of the Russian Federation about administrative offenses" has come into force since July 15, 2016.
The law was introduced by the President of the RF for the State Duma consideration in May 2016 and is aimed at assured and qualitative execution of the state defense orders (SDO).
In general, the law broadens the rights of main executor of the state defense order and clarifies the procedure of contracts support by banks. In particular, the main SDO executor is given a right to cover expenditures made of enterprise own funds for stockpiling raw materials, semi-finished products and components necessary for execution of SDO. This will give the main executors an opportunity for timely repayment of loans taken for the creation of these stocks before the end of execution, which ultimately can affect the reduction of expenditures and, consequently, reduce the cost of production.
Moreover, the law introduced a concept of “products with a long production cycle (over six months)”. Determination of the order of classifying as a product with a long production cycle and the development of the issuance of the relevant documents are imposed on federal executive bodies with a relevant competence in the field of industrial and military-industrial complexes, the State Atomic Energy Corporation "Rosatom" and the State Corporation for Space Activities "Roskosmos".
The state customer on SDO is entitled to transfer funds to the main executor, developer or manufacturer with a long production cycle in the amount of profit after partial execution of the state contract. The basis for such payment is an official document of products taken by the state customer, i.e. a separate batch of goods or phase of works (services). At the same time, the companies leading in the field of SDO execution are required to conclude contracts for the execution of SDO in the absence of reasons economically or technologically justified for refusal. Breach of this duty may give rise to an administrative penalty in the form of fines for officials in the amount from 30 to 50 thousand rubles, and from 300 thousand to one million rubles for legal entities.
The subscribers of the Information and analytical system Globas-i can look at a list of strategically important enterprises for the military and industrial complex and security of the Russian Federation in accordance with the Federal Law №213-FL as of 21.07.2014, Decree №1009 of the President of the RF as of 04.08.2004, Order of the RF Government №91-p as of 23.01.200, the Federal Law №57-FL as of 29.04.2008, as well as analysis of contracts, procurement and tenders, using new analytical tool in the relevant section of the System.
Return on assets of the largest household electrical appliances’ manufacturers in Russia
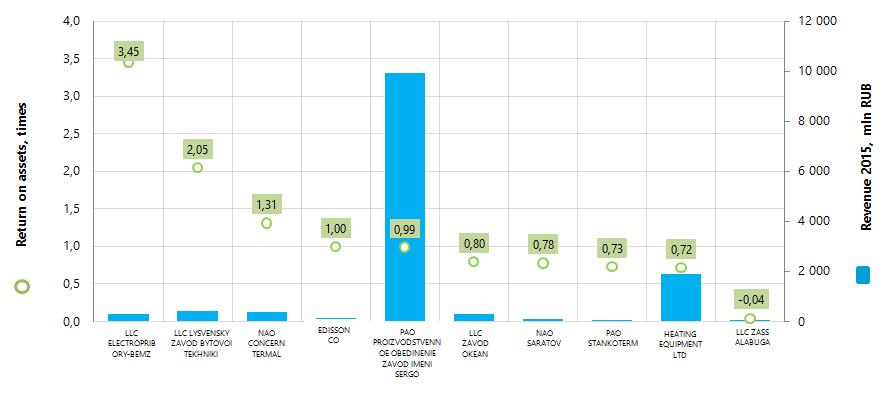
Information agency Credinform presents the ranking of household electrical appliances manufacturers on return on assets.
The largest by revenue manufacturers of household electrical appliances (TOP-10) for the last available in the Statistical register period (2015) were taken for the ranking. Further the companies were ranked in the descending order of return on assets indicator.
Return on assets (times) is calculated as a ratio of sales revenue to the average value of company’s total assets for the period. The indicator characterizes the efficiency of using all the available resources by the company, without reference to the sources of its raising. This ratio shows how many times the full production and access cycle, producing profit take place during the year.
In order to get the full and fair picture of the company’s financial situation, it is necessary to pay attention not only to the level of products profitability, but also to all the available combination of financial ratios and other indicators.
| Name, tax number, region | Net profit 2015, mln RUB. | Revenue 2015, mln RUB. | Revenue 2015 to 2014,% | Return on assets 2014, times | Return on assets 2015, times | Solvency index Globas-i ® |
|---|---|---|---|---|---|---|
| LLC ELECTROPRIBORY-BEMZ Tax number 5445115284 Novosibirsk region |
26,84 | 303,10 | 123 | 3,14 | 3,45 | 233 High |
| LLC LYSVENSKY ZAVOD BYTOVOI TEKHNIKI Tax number 5918839110 Perm Territory |
0,11 | 407,35 | 126 | 1,95 | 2,05 | 303 Satisfactory |
| NAO CONCERN TERMAL Tax number 5261017382 Nizhny Novgorod region |
-1,44 | 383,53 | 134 | 0,99 | 1,31 | 261 High |
| EDISSON CO Tax number 7810252827 Leningrad region |
3,46 | 135,08 | 80 | 1,21 | 1,00 | 233 High |
| PAO PROIZVODSTVENNOE OBEDINENIE ZAVOD IMENI SERGO Tax number 1648032420 Republic of Tatarstan |
415,69 | 9 941,87 | 169 | 0,70 | 0,99 | 213 High |
| LLC ZAVOD OKEAN Tax number 2511058935 Primorsky Territory |
-5,96 | 290,71 | 72 | 1,00 | 0,80 | 259 High |
| NAO SARATOV Tax number 6453001204 Saratov region |
-15,13 | 86,76 | 96 | 0,78 | 0,78 | 318 Satisfactory |
| PAO STANKOTERM Tax number 2632047092 Stavropolsky Territory |
0,68 | 33,72 | 103 | 0,96 | 0,73 | 231 High |
| HEATING EQUIPMENT LTD Tax number 4716025405 Leningrad region |
48,15 | 1 913,96 | 110 | 0,81 | 0,72 | 255 High |
| LLC ZASS ALABUGA Tax number 1646014828 Republic of Tatarstan |
-13,24 | 6,75 | 4 | 0,58 | 0,04 | 317 Satisfactory |
The best return on assets is shown by LLC ELECTROPRIBORY-BEMZ both in 2014 and 2015. PAO PROIZVODSTVENNOE OBEDINENIE ZAVOD IMENI SERGO took the fifth place of the ranking, having the largest revenue for 2015. The company’s share in the total revenue volume of the TOP-10 amounted to 73%.
The worst return on assets is shown by LLC ZASS ALABUGA. This enterprise is among five companies from the TOP-10, which tolerated profit decrease or loss in comparison with the previous period. Besides, the revenue of the company in 2015 amounted to only 4% of the level in 2014.
Three companies from the TOP-10 have decreased the return on assets in 2015 in comparison with the previous period.
Seven companies of the TOP were given high solvency indices Globas-i® by the combination of financial and other indicators. This gives evidence to their ability to meet their debt obligations timely and in full.
LLC LYSVENSKY ZAVOD BYTOVOI TEKHNIKI, NAO SARATOV and LLC ZASS ALABUGA were given satisfactory solvency indices Globas-i® due to information about being a defendant in debt collection arbitration proceedings.
The average value of return on assets in the group of companies TOP-10 amounted to 1,19 times in 2015 against 1,21 times in 2014. The industry-average value in 2014 amounted to 1,56 times.

The total revenue of the TOP-10 for 2015 amounted to 13,5 billion RUB, which is by 45% more than in 2014. At the same time, four companies of this group are unprofitable. Following the results of 2014, 22 companies are unprofitable in the TOP-100 group.
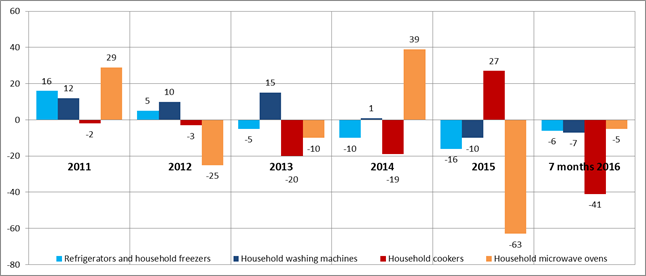
In the whole, the industry has been suffering from the certain difficulties lately, as it in many ways depends on effective public demand owing to specific of the manufactured products. It is reflected in the data of the Federal State Statistics Service (Rosstat) (Table 2, Figure 2).
| 2010 г. | 2011 г. | 2012 г. | 2013 г. | 2014 г. | 2015 г. | 7 months 2016 | |
|---|---|---|---|---|---|---|---|
| Refrigerators and household freezers | 3 556 | 4 102 | 4 316 | 4 114 | 3 723 | 3 118 | 1 711 |
| Household washing machines | 2 700 | 3 030 | 3 336 | 3 830 | 3 880 | 3 485 | 1 886 |
| Household cookers | 1 540 | 1 517 | 1 463 | 1 166 | 947 | 1 195 | 414 |
| Household microwave ovens | 1 066 | 1 379 | 1 031 | 925 | 1 285 | 464 | 262 |
| Electric grinders | 724 | 682 | 553 | 480 | 294 | 377 | 273 |
| Electric shavers | 582 | 491 | 301 | 239 | 293 | 297 | 168 |
| Household kitchen stationery electric cookers | 489 | 426 | 340 | 285 | 312 | 389 | 234 |
| Household vacuum cleaners | 232 | 111 | 61 | 52 | 55 | 18 | 13 |
| Kettles | 165 | 261 | 256 | 265 | 81 | 153 | 25 |
*) – in the table the production increase from year to year (for 2016 – to the corresponding period of 2015) is highlighted with the green shading, production decrease – with red one.
The relative rates of changes (%) of average monthly production from year to year by the largest goods groups are reflected in the Figure 2 listed below.

Companies manufacturing household electrical appliances spread relatively equally within the country’s regions and gravitate to the most developed industrial centers.
Thus, according to Information and Analytical system Globas-i®, 100 companies largest by the revenue volume for 2014 are registered in 36 regions. The biggest number of them is registered in the following regions (TOP-8 Regions):
| Region | Number of companies |
|---|---|
| Chelyabinsk region | 18 |
| Moscow | 12 |
| Saint-Petersburg | 8 |
| Saint-Petersburg | 8 |
| Moscow region | 7 |
| Leningrad region | 3 |
| Nizhny Novgorod region | 3 |
| Smolensk region | 3 |