Order a report
Custom-made industry research, company ratings, competitor analysis


2017-2019 budget – anti-risk and socially oriented
As of December 19th, 2016 the budget for 2017-2019 became a federal law under number 415-FL named “On the federal budget for 2017 and for a planning period 2018 and 2019”. The budget is made up on the basis of conservative prediction, in particular: assuming average free market oil price amounting to USD 40; annual average dollar rate amounting to RUB 67,5 per USD 1; inflation rate amounting to less than 4% at year-end.
The major part of income will be created by non-oil and gas income - 62,6%. It will be driven by increase of underlying tax receipts: value-added tax, income tax, excise duties. Decrease of federal budget oil and gas income from 37,4% in 2017 to 36% in 2019 is expected. Government domestic loans of the RF will be the main source of financing the federal budget deficit. During 2017-2019 the volume of the government debt will remain on the safe level equaling to less than 20%. Main characteristics of the budget for 2017-2019 are represented in the table 1.
| Indicator | 2017 | 2018 | 2019 |
|---|---|---|---|
| GDP (basic version), billion RUB | 86 806 | 92 296 | 96 860 |
| Inflation rate, % | Less than 4 | Less than 4 | 4 |
| Income, billion RUB | 13 487,567 | 14 028,492 | 14 844,811 |
| Expense, billion RUB | 16 240,809 | 16 039,685 | 15 986,976 |
| Deficit, billion RUB | 2 753,242 | 2 011,193 | 1 142,165 |
| Income to GDP, % | 15,5 | 15,2 | 15,0 |
| Reserve Fund (regulatory value), billion RUB | 6 076,420 | 6 460,720 | 6 920,200 |
| Domestic government debt (ceiling), billion RUB. | 10 351,624 | 11 580,941 | 12 788,387 |
| External government debt (ceiling), billion USD | 53,6 | 52,8 | 53,6 |
In 2017 the main expense items will be social policy – 5,08 trillion RUB, national economics — 2,292 trillion RUB, safety and law enforcement activities — 1,27 trillion RUB, federal issues - 1,135 trillion RUB, national security — 1,121 trillion RUB. The rest expenses are allocated as follows: inter-budget transfers - 783,5 billion RUB, government debt management — 729 billion RUB, education — 568 billion RUB, health care service — 377 billion RUB, culture and cinema art — 94 billion RUB, sport — 89,7 billion RUB, environment conservation — 76,4 billion RUB, mass media — 73,4 billion RUB, housing and public services — 58,2 billion RUB.
The budget for 2017-2019 is enacted; however the country needs aggressive priming of domestic economy growth. Therefore it is necessary to start preparing a plan of its reconstruction and reorganization. The successful result will appear in case of availability of loans, strong tax incentives, investment growth, including using budget funds, defeating nonmonetary inflation, related in the first place to growth of monopoly prices and rates, regulated by the government etc. At the moment for example such conditions are created in the agricultural sector, as a result the success on the rate of no less than 4% is expected at year-end 2016.
The experts predict slight or zero growth in the absence of serious changes. The big growth will be possible when increasing the number of average free market oil prices. The case when the cold snap in the economy will take place is regarded the worst. In its terms the system risks, prices, inflation, ruble will run out of control. It will lead to dollar strengthening, declining oil and gas prices, financial shocks, passing in form of chain reaction from one country to another.
Solvency index GLOBAS-i® of enterprises of mining and manufacturing industries
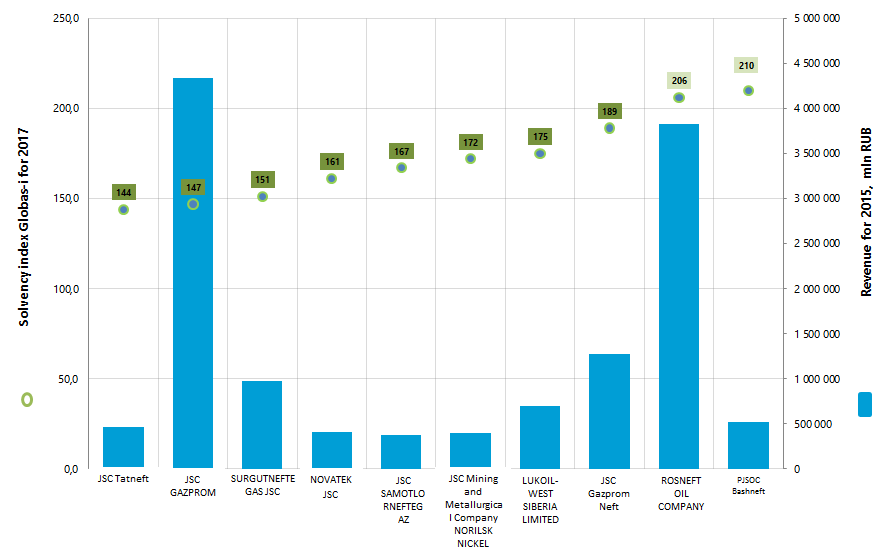
Information agency Credinform represents the ranking of the largest Russian enterprises of mining and manufacturing industries. The companies with the highest volume of revenue were selected for the ranking, according to the data from the Statistical Register for the latest available accounting period (for 2015 and 2014), which are involved in the industrial production of intermediate and end products (TOP-10), except for energy companies. Then they were ranked by the solvency index GLOBAS-i® (Table 1).
Solvency index GLOBAS-i® is an independent and comprehensive assessment of the creditworthiness and financial stability of a legal entity, has been developed by the Information agency Credinform in accordance with the world standards and takes into account the specifics of the Russian economy.
The index characterizes the company's ability to repay its long-term debts timely and fully and represents a credit rating for the determination of the default risk.
The index is used for a comprehensive assessment of the standing of a legal entity for decision-making to start or continue the cooperation with the counterparty. Assignment of the index is based on the integral index, which includes generally accepted factors of company’s solvency and financial stability.
The combination of indices of various enterprises makes possible to compare them and to evaluate the place and position in the market in comparison with indicators of direct competitors, partners and market leaders.
The index change occurs on the basis of getting of a new information, having impact on the change of the legal entity's solvency.
| Name, INN, region | Net profit for 2015, mln RUB | Net profit for 2015 by 2014, +/- % | Revenue for 2015, mln RUB | Revenue for 2015 by 2014, +/- % | Solvency index GLOBAS-i® and its dynamics for 2017 by 2016 г., +/- points |
|---|---|---|---|---|---|
| JSC Tatneft INN 1644003838 Republic of Tatarstan |
85 008,7 | 4 | 462 962,1 | 18 |
144 The highest
33
|
| JSC GAZPROM INN 7736050003 Moscow |
403 522,8 | 114 | 4 334 293,5 | 9 |
147 The highest
45
|
| SURGUTNEFTEGAS JSC INN 8602060555 Khanty - Mansiysk Autonomous District - Yugra |
751 355,3 | -16 | 978 204,5 | 13 |
151 The highest
23
|
| NOVATEK JSC INN 6316031581 Yamalo-Nenets Autonomous District |
84 103,1 | 101 | 412 703,5 | 29 |
161 The highest
44
|
| JSC SAMOTLORNEFTEGAZ INN 8603089934 Khanty - Mansiysk Autonomous District - Yugra |
63 620,2 | 19 | 373 241,6 | 16 |
167 The highest
12
|
| JSC Mining and Metallurgical Company NORILSK NICKEL INN 8401005730 Krasnoyarsk territory |
146 212,8 | 329 | 400 850,9 | 16 |
172 The highest
43
|
| LUKOIL-WEST SIBERIA LIMITED INN 8608048498 Khanty - Mansiysk Autonomous District - Yugra |
97 049,7 | 16 | 695 764,1 | 11 |
175 The highest
38
|
| JSC Gazprom Neft INN 5504036333 Saint-Petersburg |
16 145,8 | 14 | 1 272 981,1 | 2 |
189 The highest
32
|
| ROSNEFT OIL COMPANY INN 7706107510 Moscow |
239 413,3 | -52 | 3 831 094,9 | -11 |
206 High
17
|
| PJSOC Bashneft INN 0274051582 Republic of Bashkortostan |
52 306,5 | -20 | 521 038,8 | -10 |
210 High
-14
|
All TOP-10 companies got the highest and high solvency index GLOBAS-i®, that points to their ability to repay their debt obligations timely and fully. However, only one company - PJSOC Bashneft – worsened the index indicator compared with the previous period.
The total revenue of the TOP-10 enterprises amounted to 13 283 135,0 mln RUB in 2015, that is by 2% more than in 2014. At the same time the total net profit decreased by 1% in the same group.
Three companies from the TOP-10 list (highlighted in red in Table 1) allowed a reduction of net income rate or decrease in revenue compared with the previous period.
In the group of the TOP-100 companies the total revenue amounted to 25 523 384,1 mln RUB for the same period and increased by 7%, with an increase in total net income by 9%.
From 100 the largest enterprises 41% are related to the mining industry and 59% - to the sphere of production, respectively. The ratio of profit and revenue between mining and manufacturing industries are shown in Table 2.
| Profit for 2015, mln RUB | Share of profit in total sum of TOP-100, % | Revenue for 2015, mln RUB | Share of revenue in total sum of TOP-100, % | |
|---|---|---|---|---|
| Mining | 2 844 844,3 | 84 | 17 784 417,7 | 70 |
| Manufacture | 561 415,3 | 16 | 7 738 966,3 | 30 |
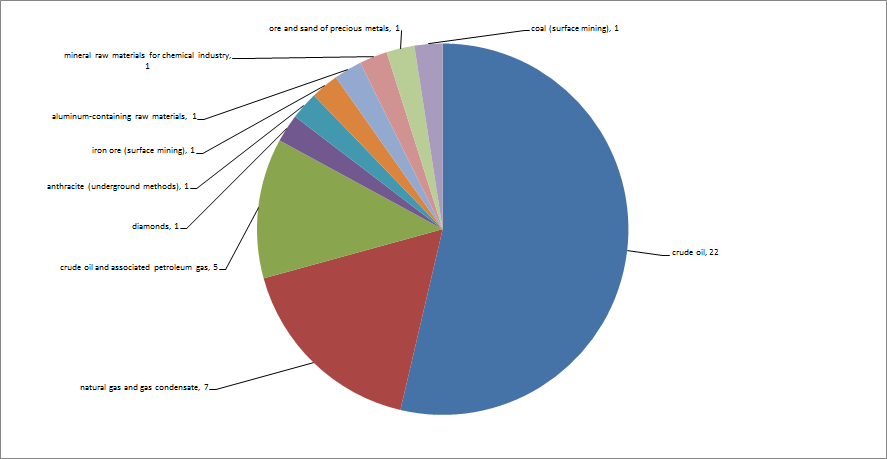
In the mining industry the largest number of enterprises is engaged in production of crude oil (Picture 2).
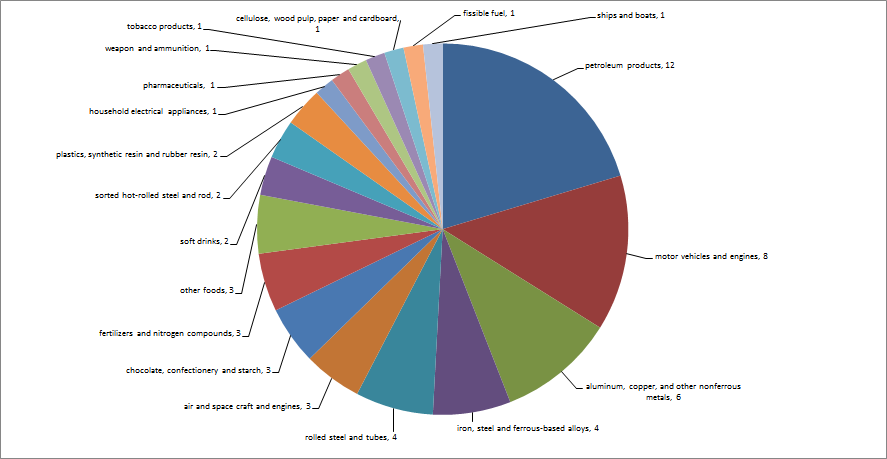
In the production sphere the highest number of companies is engaged in crude oil refining (Picture 3).
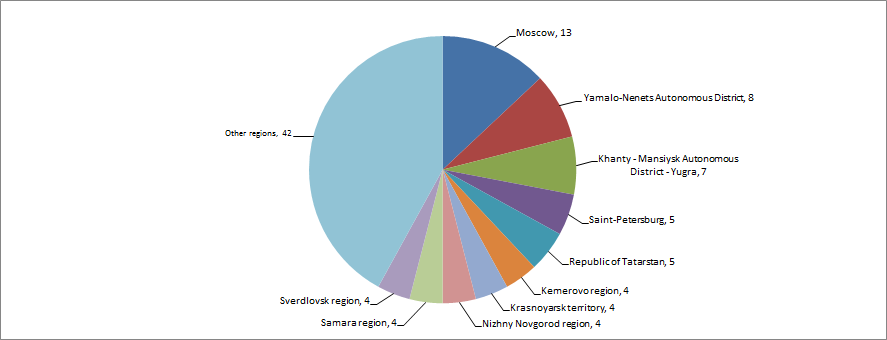
The largest enterprises of mining and manufacturing industries are distributed relatively evenly across the country, taking into account the specific nature of their activities. It is confirmed by the data of the Information and analytical system GLOBAS-i®, according to which 100 the largest companies in terms of revenue for 2015 are registered in 33 regions of Russia (Picture 4).