
Order a report
Custom-made industry research, company ratings, competitor analysis


Accounts payable turnover ratio of electric grid companies in Russia
Information Agency Credinform has prepared the ranking of electric grid companies in Russia according to the turnover rate of payables.
Top-10 enterprises in terms of annual revenue were selected according to the data from the Statistical Register for the latest available period (for the year 2014). The enterprises were ranked by decrease in the accounts payable turnover ratio.
Accounts payable turnover ratio (times) is proportion of the average accounts payable for the period to revenue. Ratio shows how many times (as a rule, for a year) company discharged average amount of accounts.
Index of accounts payable turnover ratio reflects the process of debt repayment to contractors (partners, suppliers, agents etc.). Ratio defines the quantity of debt repayment, and is calculated for cash flow valuation, that helps analyze efficiency of the company work and financial strategy.
The higher is the index, the faster company pays to its suppliers. Decrease in turnover may be implied to either problems on payment of accounts or more effective organization of relations with the suppliers, providing more profitable postponed payment schedule and using accounts payable as a source of getting cheaper financial resources.
For getting of the most comprehensive and fair picture of the financial standing of an enterprise it is necessary to pay attention not only to average values in the industry, but also to all available combination of financial data of the company.
| № | Name | Region | Turnover of 2014, th RUB | Proportion of turnover in 2014 to turnover in 2013, %% | Accounts payable turnover ratio in 2014, once a year | Solvency index Globas-i® |
|---|---|---|---|---|---|---|
| 1 | JSС "E.ON Russia" INN 8602067092 |
Khanty-Mansiysk Autonomous Okrug – Ugra | 79 955 933 | 99,3 | 15,2 | 161 The highest |
| 2 | Joint-Stock Company for Power and Electrification Mosenergo INN 7705035012 |
Moscow | 158 819 795 | 103,0 | 11,1 | 204 High |
| 3 | JSC «Second Wholesale Power Market Generating Company» INN 2607018122 |
Stavropol territory | 116 004 240 | 104,0 | 11,1 | 178 The highest |
| 4 | JSC Inter RAO — Electric Power Plants INN 7704784450 |
Moscow | 147 846 693 | 107,5 | 10,1 | 236 High |
| 5 | JSC IDGC of Centre INN 6901067107 |
Moscow | 86 705 172 | 93,3 | 9,1 | 193 The highest |
| 6 | JSC ELECTRIC POWER DIVISION OFROSATOM INN 7721632827 |
Moscow | 253 215 398 | 108,7 | 4,4 | 211 High |
| 7 | JSC T PLUS INN 6315376946 |
Moscow region | 77 851 475 | 131,8 | 4,0 | 276 High |
| 8 | JSC Federal Grid Company of Unified Energy System INN 4716016979 |
Moscow | 168 940 833 | 108,7 | 2,5 | 199 The highest |
| 9 | JSC «MOESK» INN 5036065113 |
Moscow | 125 260 155 | 100,4 | 2,5 | 232 High |
| 10 | JSC «Hydro-power generating company RusHydro» INN 2460066195 |
Krasnoyarsk territory | 108 478 000 | 99,7 | 2,5 | 197 The highest |
Accounts payable turnover ratio of the largest electric grid companies (TOP-10) varies from 15,2 times a year (JSС "E.ON Russia") to 2,5 times (JSC «Hydro-power generating company RusHydro»).
The average value of TOP-10 companies is 7,7 times. Half of TOP-10 companies are below that rate.
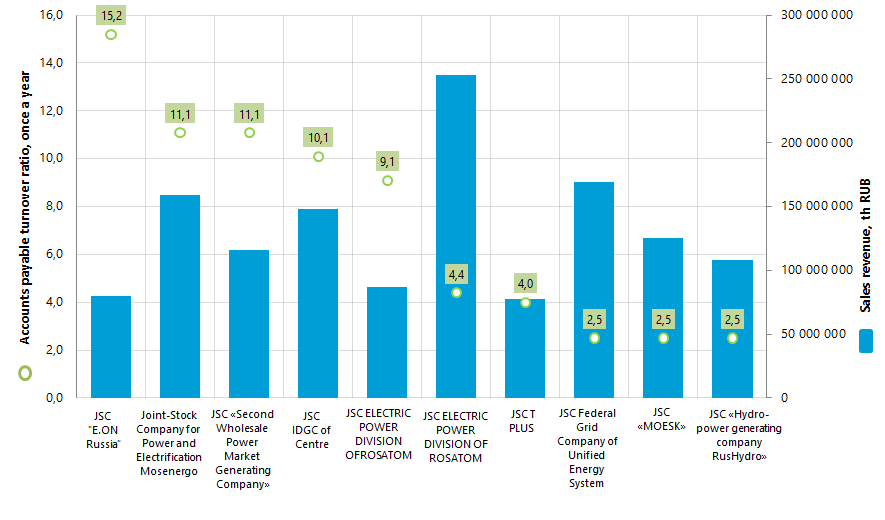
Picture 1. Accounts payable turnover ratio and revenue of the largest electric grid companies in Russia (TOP-10)
As it is seen on the diagram, accounts payable turnover ratio is not in direct dependence from the revenue for the year. For example, the largest by revenue company JSC ELECTRIC POWER DIVISION OF ROSATOM is on the sixth place of the ranking. However, this enterprise demonstrates one of the best dynamic revenue rates to the previous period. As a whole it may show effective work of the enterprise and manipulation of accounts payable as additional financial source. Besides, the company is monopolist in electric power production on nuclear plants.
On the first place according to accounts payable turnover ratio is JSС E.ON Russia with almost worst revenue rates among TOP-10 companies both for 2014 and dynamics to the previous year.
According to the latest financial account for 2014, total annual revenue of TOP-10 leaders in the industry was 1 323 bln RUB, that is 5,2% higher than values of the previous period. However, 3 of 10 companies made revenue rates worse compared to the previous period.
All the participants of TOP-10 list got the highest and high solvency index Globas-i®. It shows that all companies are able to pay off the debts in time and to the full extent, risk of non-fulfillment for those is minimal.
You can read comments of the Credinform experts on development of electric power complex in the articles of «Kommersant Business Guide» newspaper: «Dense covering of networks», «Fresh blood in the wires».