
Order a report
Custom-made industry research, company ratings, competitor analysis


Return on assets of restaurant business
Information agency Credinform prepared a ranking of the return of assets of restaurant business in Russia. The companies with highest volume of revenue were selected for the research according to data from the Statistical Register for the latest available period (for the year 2012). Then, the first 10 enterprises selected by turnover were ranked by decrease in return on assets value.
Return on assets is a financial indicator, which shows how many monetary units of net profit were earned by each unit of total assets; is calculated as the relation of net profit and interests payable to company’s total assets value. This ratio represents the ability of an organization to generate profit, without regard to capital structure. As for all profitability ratios there are no specified values prescribed for the analyzed ratio, because its value varies strongly depending on the branch, where an enterprise operates.
| № | Name, INN | Region | Turnover for 2012, in mln RUB | Return on assets, (%) | Solvency index GLOBAS-i® |
|---|---|---|---|---|---|
| 1 | Makdonalds LLC INN 7710044140 |
Moscow | 42 532 | 25,21 | 138 (the highest) |
| 2 | Moskva – MakdonaldsCJSC INN 7710044132 |
Moscow | 12 894 | 17,2 | 153 (the highest) |
| 3 | FASTLEND LLC INN 7703234453 |
Moscow | 3 097 | 15,02 | 196 (the highest) |
| 4 | AEROPIT-SERVIS LLC INN 5047061576 |
Moscow region | 1 030 | 6,98 | 224 (high) |
| 5 | Teremok – Russkie Bliny LLC INN 7825483150 |
Saint-Petersburg | 1 364 | 1,81 | 201 (high) |
| 6 | RESTORANNAYA OB’EDINENNAYA SET I NOVEISHIE TEHNOLOGII EVROAMERIKANSKOGO RAZVITIYA RESTORANTS LLC INN 7737115648 |
Moscow | 6 849 | 0,4 | 231(high) |
| 7 | BRAZERS I KOMPANIYA LLC INN 7710227312 |
Moscow region | 1 703 | 0,12 | 235 (high) |
| 8 | LANCH ZAO INN 7710215170 |
Moscow region | 1 976 | 0,05 | 550 (satisfactory) |
| 9 | AmRest LLC INN 7825335145 |
Saint-Petersburg | 3 028 | -1,86 | 214 (high) |
| 10 | KOFE HAUS. ESPRESSO I KAPUCHINO BAR LLC INN 7704207300 |
Moscow | 3 821 | -4,62 | 269 (high) |
The dominant position on the Russian restaurant market is held by networks focused mainly on mid-range segment. For the most part these are so called fast food stations.
The first place of the ranking list belongs to the industry leader on turnover Makdonalds LLC with the return on assets 25,21%. The company also got the highest solvency index GLOBAS-i® that characterizes it as more attractive for business cooperation.
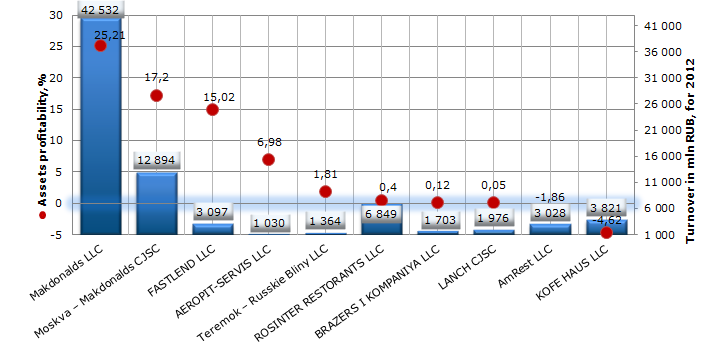
Picture. Return on assets of restaurant business, TOP-10
Moskva – Makdonalds CJSC and FASTLEND LLC are on the second and the third places in the ranking with the return on assets values 17,2 and 15,02% respectively. Both companies got the highest solvency index GLOBAS-i® that characterizes them as financially stable.
The return on assets value of RESTORANNAYA OB’EDINENNAYA SET I NOVEISHIE TEHNOLOGII EVROAMERIKANSKOGO RAZVITIYA RESTORANTS LLC and BRAZERS I KOMPANIYA LLC is less than 1 and made only 0,4 and 0,12% respectively. And the ratio values of companies AmRest LLC and KOFE HAUS. ESPRESSO I KAPUCHINO BAR LLC is negative at all. Such results can testify to ineffective administration of assets on the part of enterprise management. However, all four companies got a high solvency index GLOBAS-i®, because the assessment of the company's attraction for business cooperation is comprehensive and takes into account the combination of factors.
The company Lanch CJSC with the return on assets value 0,05% got a satisfactory solvency index GLOBAS-i®, because there are data on non-fulfillment of obligations by the enterprise.
Analyzing results of companies-industry leaders, it may be noted that, unfortunately, the return on assets ratio of most companies in the ranking (7 from 10) couldn’t reach 10%, that can testify of low efficiency of using assets, this is because the service sector is traditionally more profitable, than capital intensive industries. However, because the value under investigation takes into account all assets of an organization, and not only own funds, then often it is less interesting for investors. That is why, for the comprehensive assessment of a situation in the industry it should be considered the combination of financial and non-financial indicators.