
Order a report
Custom-made industry research, company ratings, competitor analysis


Profit of software developers
Information agency Credinform represents a ranking of the largest Russian software developers. Software developers and companies rendering consultancy services in this business area (TOP-10) with the largest annual revenue were selected for the ranking, according to the latest accounting periods in the Statistical Register (2017 – 2019). Then they were ranked by the net profit ratio (Table 1). The analysis was based on the data from the Information and Analytical system Globas.
Net profit ratio (%) is a relation of net profit (loss) to sales revenue. It is an indicator of the level of sales revenue.
There is no standard value for this ratio. It is recommended to compare companies of the same industry, or change in the ratio of the specific company. Negative value of the ratio is indicative of the net loss, and the high one means the efficiency of the company.
For the most complete and objective view of the financial condition of the enterprise, it is necessary to pay attention to the complex of indicators and financial ratios of the company.
| Name, INN, region | Revenue, million RUB | Net profit (loss), million RUB | Net profit ratio, % | Solvency index Globas | |||
| 2018 | 2019 | 2018 | 2019 | 2018 | 2019 | ||
| 1 | 2 | 3 | 4 | 5 | 6 | 7 | 8 |
| V KONTAKTE LTD INN 7842349892 Saint Petersburg |
|
|
|
|
|
|
189 High |
| MFI SOFT LIMITED INN 5260146265 Nizhnii Novgorod region |
|
|
|
|
|
|
171 Superior |
| JSC MEGALABS INN 7713556058 Moscow |
|
|
|
|
|
|
178 High |
| YANDEX LLC INN 7736207543 Moscow |
|
|
|
|
|
|
170 Superior |
| EPAM SYSTEMS LTD INN 7719232155 Moscow |
|
|
|
|
|
|
193 High |
| IBS EXPERTISE INN 7713606622 Moscow |
|
|
|
|
|
|
227 Strong |
| SKB KONTUR INN 6663003127 Sverdlovsk region |
|
|
|
|
|
|
173 Superior |
| INFORMATION AND TECHNOLOGY SERVICE COMPANY INN 7728654530 Saint Petersburg |
|
|
|
|
|
|
269 Medium |
| IBS PLATFORMIX INN 7707507077 Moscow |
|
|
|
|
|
|
189 High |
| LIMITED LIABILITY COMPANY SAP CIS INN 7705058323 Moscow |
|
|
|
|
|
|
265 Medium |
| Average value for TOP-10 | |
|
|
|
|
|
|
| Industry average value | |
|
|
|
|
|
|
![]() improvement compared to prior period,
improvement compared to prior period, ![]() decline compared to prior period
decline compared to prior period
Average value of debt-to-assets ratio of TOP-10 companies is above the average industry one. Five companies improved the standard value in 2019.
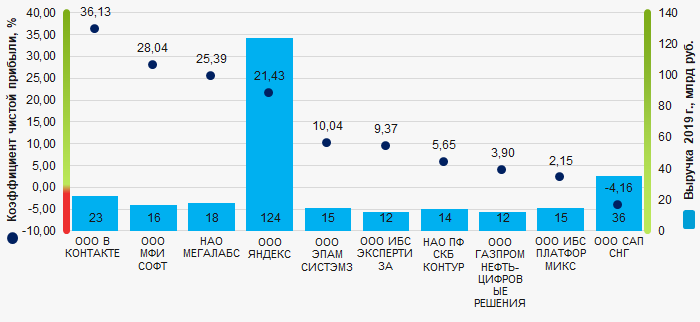 Picture 1. Net profit ratio and revenue the largest software developers in Russia (TOP-10)
During the decade, average industry values of net profit ratio had a tendency to decrease. (Picture 2).
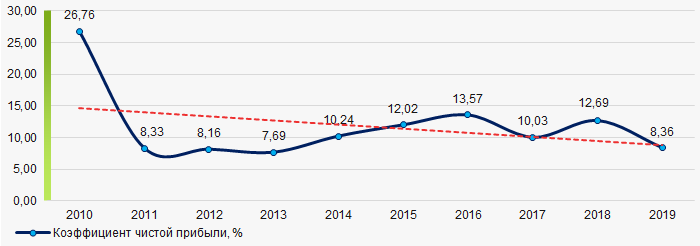 Picture 2. Change of industry average values of net profit ratio of software developers in Russia in 2010 – 2019