Order a report
Custom-made industry research, company ratings, competitor analysis


Procurements will support the economy
In spite of crisis developments in the economy, the number of procurements of state-owned companies and budget organizations in Russia carried out within the Federal Laws 223-FZ and 44-FZ is on the increase. The main difference between the two Federal Laws, governing the contract system, is the source of financing. Thus, in procurements by 223-FZ a customer pays (carries out) the supply of a good (work, service) from own funds, including via grants, funds obtained by the implementation of income-generating activities, and by 44-FZ - at the expense of federal and local budgets.
In total as of year-end 2015 3,0 mln notices on procurements were published by 44-FZ, that is by 10,4% more than the level of 2014, and nearly 1,3 mln notices on procurements by 223- FZ, increase for the year - by 18,4% (s. picture 1).
 Picture 1. Change of the number of notices of procurements by 223-FZ and 44 (94-FZ)
The increase in the absolute number of procurements is accompanied by a significant increase in the total value of all procurement procedures, the money for the implementation of which (in case of the conclusion of agreements, contracts) will be directed to suppliers that will monetary support the business under the existing difficulties of credit attracting and private investments (s. Picture 2). The total volume of notices on published procurements in 2015 is estimated at 29,5 trillion RUB, that is 36,5% of Russia's GDP (80,8 trillion RUB).
In relative terms, the cost of procurements by 223-FZ grew by 29,9% for the year (up to 23,1 trillion RUB), by 44-FZ - by 7,2% (up to 6,5 trillion RUB).
 Picture 2. Change of the total value of procurements on the posted notices, bln RUB
According to the Picture 3, the average cost of one procurement carried out by 223-FZ increased by 9,7% in 2015 (up to 18,2 mln RUB), and the average value of a procurement by 44-FZ decreased slightly - by 3,0% (up to 2,1 mln RUB).
 Picture 3. Change in the average value of one procurement on the published notices, mln RUB
As of the 2nd of May 2016, 80,6 thousands registered customers carry out the procurements by 223-FZ, that is almost two times higher than their number at the end of 2013. About 260 thousands customers are currently involved in procurements by 44-FZ (94-FZ), and their amount is slightly higher than the data of the end of 2013 (s. Picture 4), because the number of budget organizations in Russia has no tendency to a significant increase.
 Picture 4. Change of the number of registered customers
The maximum total value of contracts as a result of procurements by 44-FZ at year-end 2015 belongs to the Federal state-owned institution «Upravlenie federalnykh avtomobilnykh dorog «Taman» Federalnogo dorozhnogo agentstva» (The Department of federal automobile roads «Taman» of the Federal Road Agency). The Department has concluded contracts for a total sum of 228,3 bln RUB. The company carries out the design and construction of a bridge across the Kerch Strait. Next in the ranking of the largest customers are: Construction department of Moscow – 133,6 bln RUB, and the Ministry of Defense of the RF - 114 bln RUB. (s. Table 1).
Regarding the institutions, which most often carry out procurements by 44-FZ, here you can see a somewhat different picture: the Department of Health of Moscow takes the first place, which published 3504 procurement notices in the preceding year, it is followed by the State public institution «Upravlenie materialno-tekhnicheskogo obespecheniya Ministerstvo zdravookhraneniya Respubliki Bashkortostan» – 3179 procurements.
Table 1. Major customers on the amount of the completed contracts and the number of procurements in 2015 under the Federal Law 44-FZ
| № | Name of the customer | Amount of the completed contracts, mln RUB |
|---|---|---|
| 1 | Federal state-owned institution «Upravlenie federalnykh avtomobilnykh dorog «Taman» Federalnogo dorozhnogo agentstva» | 228 344 |
| 2 | Construction department of Moscow | 133 582 |
| 3 | Ministry of Defense of the RF | 114 030 |
| 4 | Federal Space Agency («Roskosmos») | 104 850 |
| 5 | Committee for St. Petersburg Transport Infrastructure Development | 94 713 |
| № | Name of the customer | Number of procurements |
| 1 | Department of Health of Moscow | 3 504 |
| 2 | State public institution «Upravlenie materialno-tekhnicheskogo obespecheniya Ministerstvo zdravookhraneniya Respubliki Bashkortostan» | 3 179 |
| 3 | Ministry of Defense of the RF | 2 257 |
| 4 | Department of Health and Social Protection of the population of Belgorod region | 2 132 |
| 5 | State public institution of Novosibirsk region «Novosiboblfarm» | 1 966 |
On the total value of procurements made within the Federal Law 223-FZ Rosneft Oil Company JSC is the undisputed leader. The total cost of lots of this customers is 5,6 trillion RUB or more than 24% of the sum of all procurements on this Federal Law (s. Table 2).
And a major Russian carrier – RZHD JSC (Russian Railways) - is involved in procurements as a customer the most frequently: in 2015 the company held 18 182 procurement procedures.
Table 2. Major customers on the total price of lots and the number of procurements in 2015 under the Federal Law 223-FZ
| № | Name of the customer | Total price of lots, mln RUB |
|---|---|---|
| 1 | Rosneft Oil Company JSC | 5 609 444 |
| 2 | Gazprom pererabotka Blagoveshchensk LLC | 801 560 |
| 3 | Uralsevergaz - nezavisimaya gazovaya kompaniya JSC | 630 939 |
| 4 | Kuzbasskaya energosetevaya kompaniya LLC | 629 619 |
| 5 | Gazprom neftekhim Salavat JSC | 603 003 |
| № | Name of the customer | Number of procurements |
| 1 | Russian Railways JSC | 18 182 |
| 2 | Rostelecom PJSC | 7 746 |
| 3 | Sberbank of Russia PJSC | 5 565 |
| 4 | T Plus PJSC | 5 451 |
| 5 | Rosneft Oil Company JSC | 3 569 |
Thus, the contract system intended to implement procurement activities of state budget legal entities on a competitive basis, reduce corruption component and increase their transparency, turned on top of that into a huge system of redistribution of financial flows to the real economy, the size of which is comparable with the quarterly GDP of Russia, in particular GDP of the RF in the IV quarter of 2015 amounted to 22,0 trillion RUB. This fact can be considered as a boon for the business environment, in conditions of tough monetary policy of the Central Bank and the inability to obtain credits in Western banks due to the imposed sanctions. Not only large suppliers can connect to this source of «long» money, but also small business, individual entrepreneurs and even natural persons, offering an unique product to the market. According to the Federal Law* not less than 15% of the total annual volume of procurements must be purchased from small businesses.
* According to Part. 1, Article 30 of the Federal Law № 44-FZ "About contract system in the procurements of goods, works and services for state and municipal needs" from 05/04/2013, customers are obliged to make purchases from small businesses, socially oriented non-profit organizations in the volume of not less than fifteen percent of the total annual volume of procurements.
Debt ratio of the largest Russian shipbuilding companies
Information Agency Credinform has prepared the ranking of the largest Russian shipbuilding companies by debt ratio. The largest enterprises in terms of revenue were selected according to the data from the Statistical Register for the latest available period (for the year 2014). Then, first ten companies (Top-10) were ranged by increase in debt ratio (Table 1).
Debt ratio is one of the financial stability ratios. The ratios of this group are the most interesting in terms of exploring the possibility of granting the long-term loans or investing as it characterizes the possibility of the company to meet its long-term obligations. Thus, the debt ratio is calculated as a ratio of total borrowed funds to equity capital and shows how many units of borrowed funds the company had attracted to each unit of own sources of financing.
The recommended value of the ratio is less than 1. The debt to assets ratio should not be negative, that’s why the ratio value from 0 to 1 is one of the indicators of company’s high ability to meet its obligations.
The calculation of practical values of financial indicators, which might be considered as normal for a certain industry, has been developed and implemented in Information and analytical system Globas-i® by the experts of Information Agency Credinform. The practical value of debt ratio for shipbuilding industry is from 0 to 4,88.
| Name, INN, region | 2014 net profit (loss), th RUB | 2014 revenue, th RUB | 2014/ 2013 revenue, % | Debt ratio, (х) | Solvency index Globas-i® |
|---|---|---|---|---|---|
| JSC UNITED SHIPBUILDING CORPORATION INN 7838395215, Saint-Petersburg | 510 420 | 23 161 847 | 583 | 1,23 | 283 High |
| JSC Admiralteiskie Verfi INN 7839395419, Saint-Petersburg | 2 575 347 | 36 386 181 | 126 | 3,03 | 203 High |
| Almaz Shipbuilding Company INN 7813046950, Saint-Petersburg | 269 204 | 5 955 834 | 172 | 3,44 | 196 The highest |
| JSC Production Association «Northern machine – building enterprise» INN 2902059091, Arkhangelsk region | 3 303 852 | 51 491 685 | 118 | 10,06 | 189 The highest |
| JSC SHIPREPAIRING CENTER ZVYOZDOCHKA INN 2902060361, Arkhangelsk region | 15 054 | 37 877 959 | 139 | 12,87 | 263 High |
| JSC AMUR SHIPBUILDING PLANT INN 2703000015, Khabarovsk region | 67 525 | 8 184 291 | 215 | 16,65 | 272 High |
| JSC SHIPBUILDING PLANT SEVERNAYA VERF INN 7805034277, Saint-Petersburg | -1 101 716 | 13 494 252 | 88 | 36,25 | 308 Satisfactory |
| OJSC LENINGRAD SHIPYARD PELLA INN 4706000296, Leningrad region | -1 933 811 | 5 119 557 | 109 | 41,40 | 270 High |
| JSC Shipyard Yantar INN 3900000111, Kaliningrad region | 712 004 | 27 673 735 | 227 | 188,08 | 228 High |
| JSC VYBORG SHIPYARD INN 4704012874, Leningrad region | 49 | 5 897 758 | 136 | -25,20 | 285 High |
The analysis of the results shows that none of Top-10 companies has the recommended value of debt ratio. The first three places of the ranking take the companies with debt ratio value in the range of practical standard. Other companies have ratio values from 10,06 to 118,08. The debt ratio of JSC VYBORG SHIPYARD has negative value. This means that total borrowed funds exceed equity capital of the company.
In 2014 the average value of the indicator within industry amounted to 4,2. All the above testifies about the high level of debt load of Top-10 companies as well as enterprises within industry as a whole. Taking into account the financial and non-financial indicators, 9 out of 10 participants from the Top-10 list have the highest and high solvency index Globas-i®, that characterizes them as financially stable. JSC SHIPBUILDING PLANT SEVERNAYA VERF has satisfactory solvency index Globas-i® because of loses in 2013-2014 and reduction in revenue.
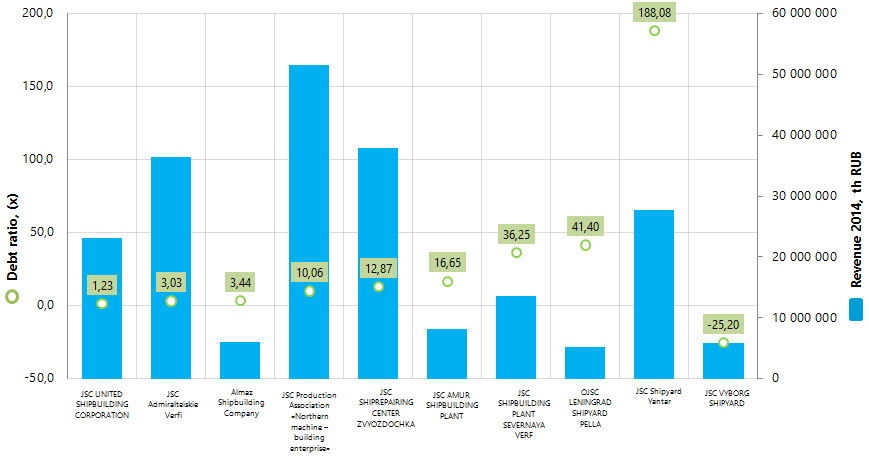
The largest enterprise within the industry by 2014 revenue JSC Production Association «Northern machine – building enterprise» takes the fourth place of the ranking with the debt ratio value 10,06. JSC UNITED SHIPBUILDING CORPORATION has the best ratio value 1,23. In 2014 the enterprise covered the loss, exceeding 300 mln RUB, got a profit of over 500 mln RUB and increased the revenue by more than 5 times in comparison with previous period.
Total revenue of Top-10 enterprises in 2014 amounted to 209,3 bln RUB, that is 46% more than in 2013.
High concentration of shipbuilding companies in Saint-Petersburg and Leningrad region should be noted. 6 enterprises from the Top-10 list are registered in these regions. Besides, 5 enterprises of the ranking are the part of JSC UNITED SHIPBUILDING CORPORATION structure: JSC Admiralteiskie Verfi, JSC Shipyard Yantar, JSC SHIPBUILDING PLANT SEVERNAYA VERF, JSC VYBORG SHIPYARD and JSC SHIPREPAIRING CENTER ZVYOZDOCHKA.
|
2010 |
2011 |
2012 |
2013 |
2014 | |
|---|---|---|---|---|---|
| Cargo and freight-passenger vessels | 9 | 20 | 9 | 11 | 10 |
| Marine tugs (except push tug boats) | 8 | 8 | 10 | 10 | 13 |
| Marine non-self-propelled liquid cargo vessels | 1 | 1 | 1 | 1 | |
| Marine passenger vessels | 1 | 1 | |||
| Marine self-propelled catching vessels | 7 | 9 | 1 | ||
| Marine self-propelled dry cargo vessels | 1 | ||||
| River and lake-type passenger vessels | 44 | 67 | 57 | 38 | 24 |
| River and lake-type self-propelled vessels | 3 | ||||
| River non-self-propelled dry cargo vessels | 8 | 12 | 7 | 11 | 7 |
| Fishing vessels; fish farm and other vessels for processing or preserving of fishery products | 9 | 9 | 1 | 2 | |
| Self-propelled catching vessels (technical and auxiliary type) | 2 | 2 | |||
| Total: | 89 | 126 | 86 | 75 | 59 |
The number of vessels (units) according to the Federal Agency for Sea and Inland Water Transport, supervised by the Russian Maritime Register of Shipping with gross tonnage of more than 100 gross tons, which should be included in the State Register of vessels or shipping book of one of the country’s marine or fishing ports in accordance with the Merchant Shipping Code of the Russian Federation and have vessel's certificate (certificate of navigation or ship's letter), identifying the right of navigation under the State flag of the Russian Federation and ownership or use of the vessel: