
Order a report
Custom-made industry research, company ratings, competitor analysis


Trends in residential and non-residential construction in the Northwestern Federal District
Information Agency Credinform presents a review of trends in residential and non-residential construction in the Northwestern Federal District of Russia.
The enterprises of the sector within the Northwestern Federal District with the highest volume of annual revenue (TOP-10 and TOP-5000) have been selected for the ranking, according to the data from the Statistical Register for the latest available accounting periods (2015 and 2016). The analysis was based on the data from the Information and Analytical system Globas.
Legal forms and unreliable data
Limited liability company is the prevailing legal form among companies of the sector within the Northwestern Federal District. Non-public joint stock companies’ fraction is significant too (Picture 1).
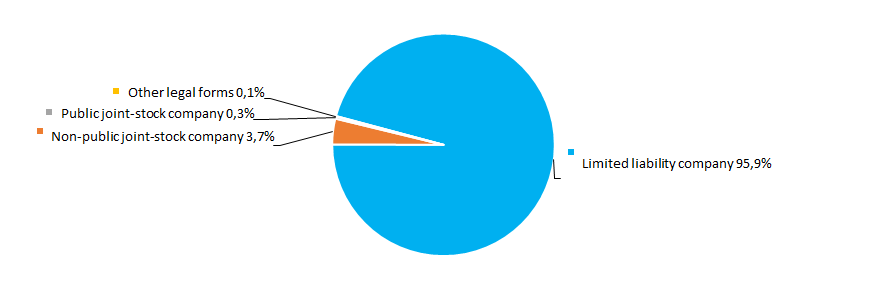 Picture 1. TOP-5000 companies of the Northwestern Federal District by legal form
As a result of investigations of the Federal Tax Service of Russia, almost 4% of the companies of the sector within the Northwestern Federal District have faced entries concerning unreliability of data in the Unified State Register of Legal Entities (Picture 2).
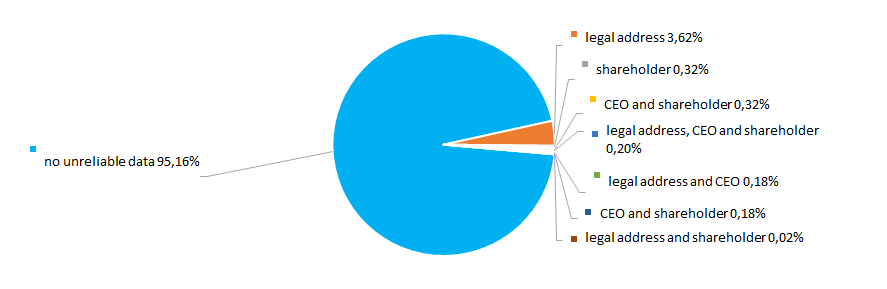 Picture 2. TOP-5000 companies of the Northwestern Federal District by entries concerning unreliability of data in EGRUL
Sales revenue
In 2016, sales revenue of 10 industry leaders within the Northwestern Federal District amounted to 18% of total revenue of TOP-5000 companies. This points to a high degree of business competition within the industry. LSR. REAL ESTATE-NORTHWEST LLC is the largest company by revenue in 2016 (Picture 3).
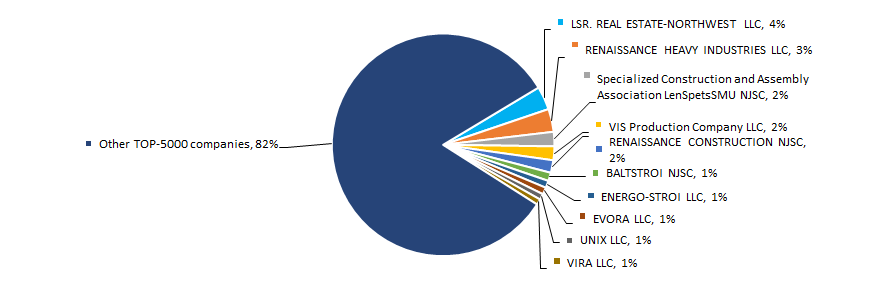 Picture 3. TOP-10 companies by their share in 2016 total revenue of TOP-5000 companies of the Northwestern Federal District
2011 witnessed the best revenue results in the decade for the industry in general. Crisis periods in economy of 2009-2010, 2012-2013 and 2015 resulted in decrease in industry average values. In general, revenue demonstrates relative stability (Picture 4).
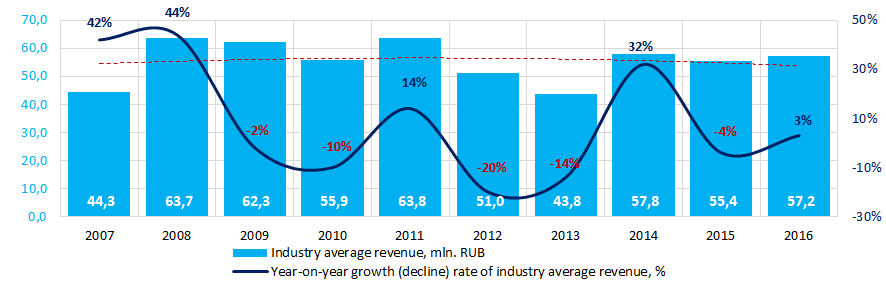 Picture 4. Change in industry average revenue of residential and non-residential construction companies in 2007-2016
Profit and loss
In 2016 profit of 10 industry leaders within the Northwestern Federal District amounted to 45% of total profit of TOP-5000 companies. LSR. REAL ESTATE-NORTHWEST LLC is also the leading company by profit in 2016 (Picture 5).
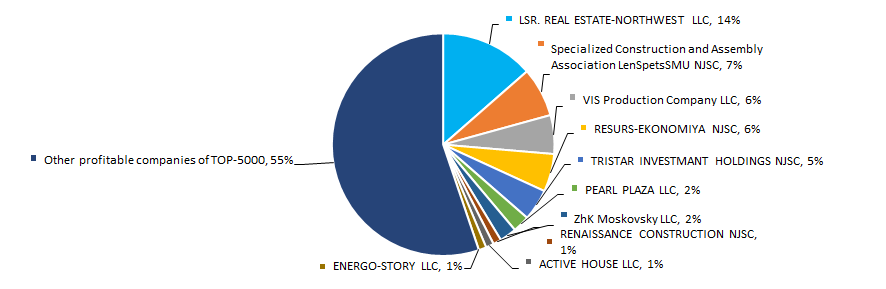 Picture 5. TOP-10 companies by their share in 2016 total profit of TOP-5000 companies of the Northwestern Federal District
Average profit values of the companies of the sector are not stable within the decade. There were negative values in 2014 – 2015 against the backdrop of economic downturn. 2016 witnessed some increase in profit, but in general profit tends to decline. The industry has performed its best in 2008 (Picture 6).
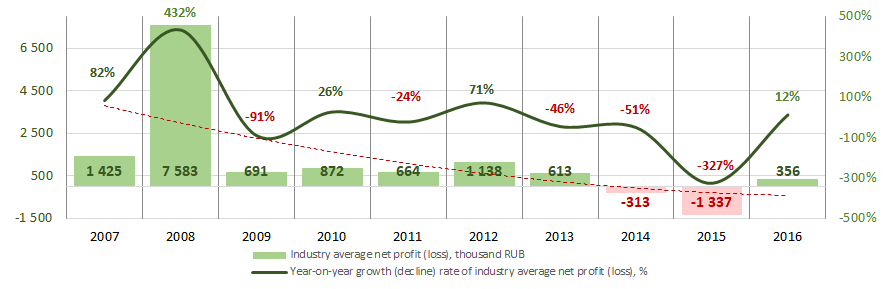 Picture 6. Change in industry average profit of residential and non-residential construction companies in 2007 – 2016
 There were 724 loss-making enterprises among TOP-5000 companies in 2015. In 2016 the number decreased to 678, or by 6%. Moreover, their average loss increased by 36%. Average profit of other TOP-5000 companies has increased by 6% for the same period (Picture 7).
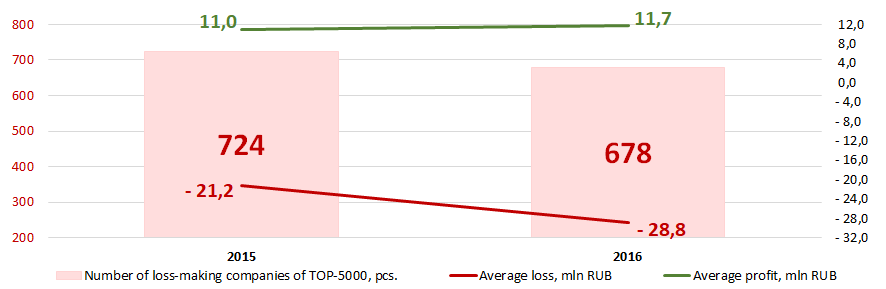 Picture 7. Number of loss-making companies, average values of loss and profit of TOP-5000 companies within the Northwestern Federal District in 2015-2016
Key financial ratios
During 9 years within the decade industry average values of liquidity coverage ratio were lower than the recommended value – from 1,0 to 2,0 (highlighted yellow in Picture 8>).
Liquidity coverage ratio (a ratio of current assets to current liabilities) reveals the sufficiency of a company’s funds for meeting its short-term liabilities.
Solvency ratio (a ratio of shareholders’ equity to total assets) shows the dependence of the company on external loans. Its recommended value: >0,5. A value less than a minimum one is indicative of a strong dependence on external sources of funds.
A calculation of practical values of financial ratios, which might be considered as normal for a certain industry, has been developed and implemented in the Information and Analytical system Globas by the experts of Information Agency Credinform, having taken into account the current situation in the economy as a whole and in the industries. The practical value of solvency ratio for residential and non-residential construction companies in 2016 is from 0,01 to 0,85.
During 9 years within the decade industry average values were below the recommended value and above the practical value (Picture 8).
In general, the ratios under consideration demonstrate diverse trends.
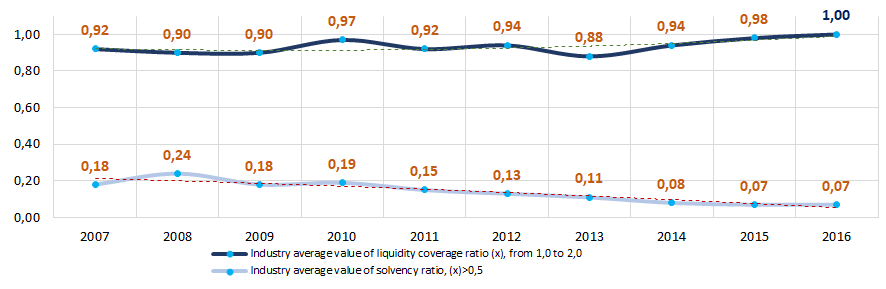 Picture 8. Change in industry average values of liquidity coverage ratio and solvency ratio of residential and non-residential construction companies in 2007 – 2016
 The return on investment ratio was not stable during the decade. Ratio values became negative during economic downturn in 2014 – 2015 (Picture 9). It is a ratio of net profit to shareholders’ equity and noncurrent liabilities, and it demonstrates benefit from shareholders’ equity engaged in business activity and long-term raised funds of the company.
There is a more stable trend in cost to revenue ratio (Picture 9). The ratio is calculated as a ratio of sales profit to operation costs. In general, it reflects production efficiency.
In general, both ratios tend to decrease.
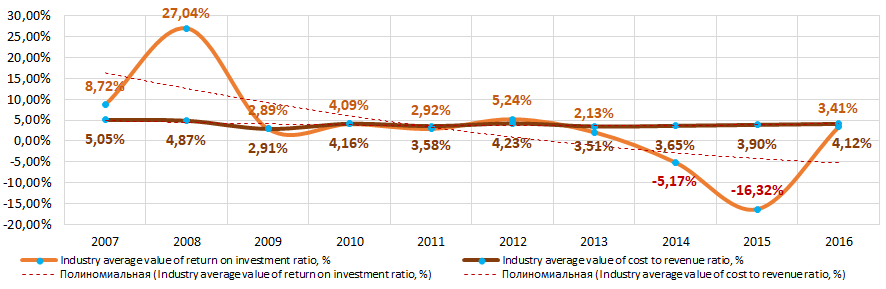 Picture 9. Change in industry average values of return on investment ratio and cost to revenue ratio of residential and non-residential construction companies 2007 – 2016
Assets turnover ratio is a ratio of sales revenue to average total assets for the period, and measures resource efficiency regardless of the sources. The ratio indicates the number of profit-bearing complete production and distribution cycles per annum.
Shareholders’ equity turnover ratio is a ratio of revenue to annual average shareholders’ equity, and indicates total assets usage rate.
During the decade, assets turnover ratio tended to decrease slightly, and shareholders’ equity ratio showed a considerable increasing trend (Picture 10).
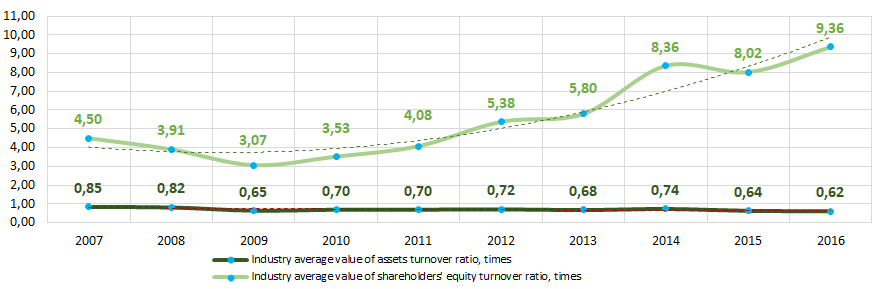 Picture 10. Change in industry average values of activity ratios of residential and non-residential construction companies 2007 – 2016
Business activity trends
There is a diversity in distribution of registered TOP-5000 companies within the Northwestern Federal District by the year of their foundation within a 25-year period. The most of the companies were founded in 2015. In general, there is a trend of increase in the amount of companies being registered (Picture 11).
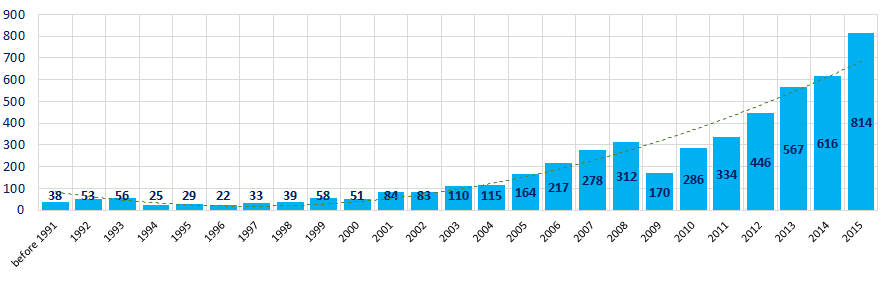 Picture 11. ТOP-5000 companies of the Northwestern Federal District by the year of foundation
Private sector has shown the strongest interest in residential and non-residential construction after 2010 (Picture 12).
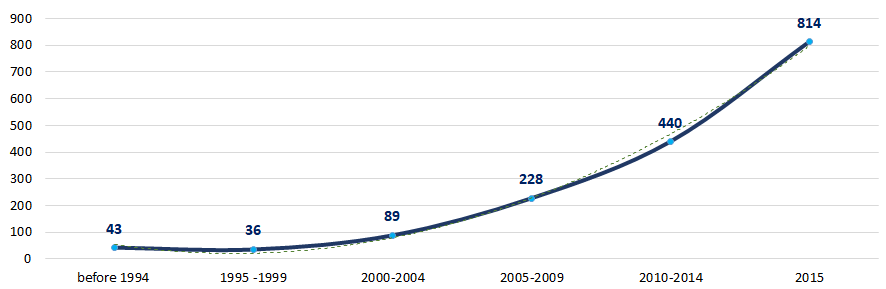 Picture 12. Average number of TOP-5000 companies of the Northwestern Federal District registered per year, by their foundation periods
Key home regions
The companies of the sector are unevenly distributed throughout the Northwestern Federal District. Most of them are registered in Saint Petersburg that is the region with the largest population size and extensive financial and transportation infrastructure (Picture 13).
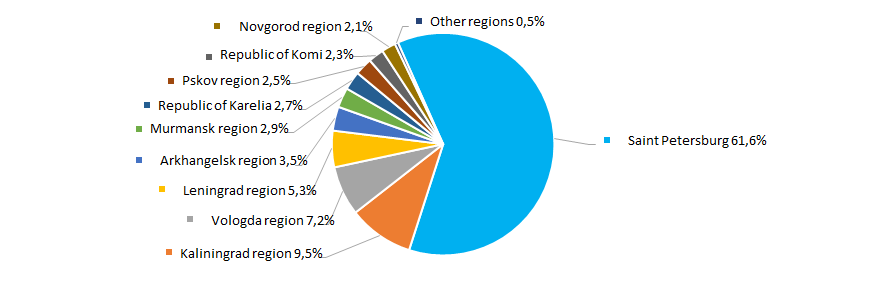 Picture 13. TOP-5000 companies of the Northwestern Federal District by region
 2,5% of TOP-5000 companies of the Northwestern Federal District have branches and representative offices.
Participation in arbitration proceedings
Most companies of the sector within the Northwestern Federal District either do not participate in arbitration proceedings, or participate in a small number of cases (Picture 14).
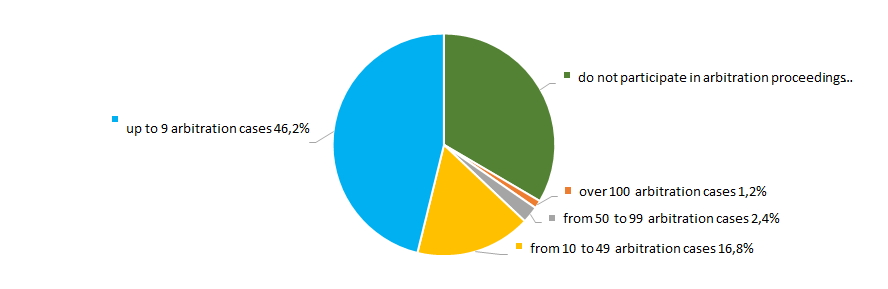 Picture 14. TOP-5000 companies of the Northwestern Federal District by their participation in arbitration proceedings
Reliability index
The risk of meeting a fly-by-night company or an unreliable company is extremely low for the most companies of the sector within the Northwestern Federal District (Picture 15).
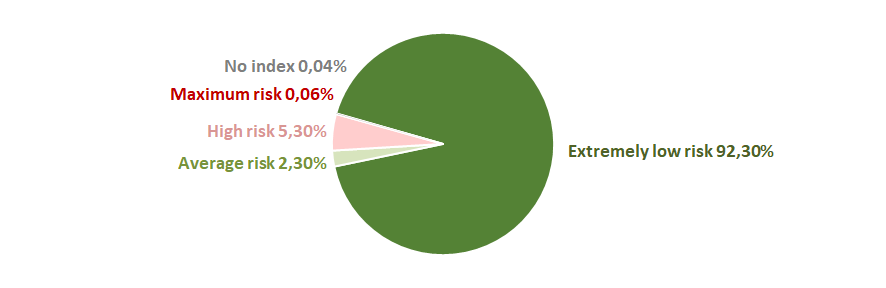 Picture 15. TOP-5000 companies of the Northwestern Federal District by Reliability index
Financial position score
Assessment of financial state of the sector’s companies within the Northwestern Federal District indicates that over a half of the companies have an average or unstable financial standing (Picture 16).
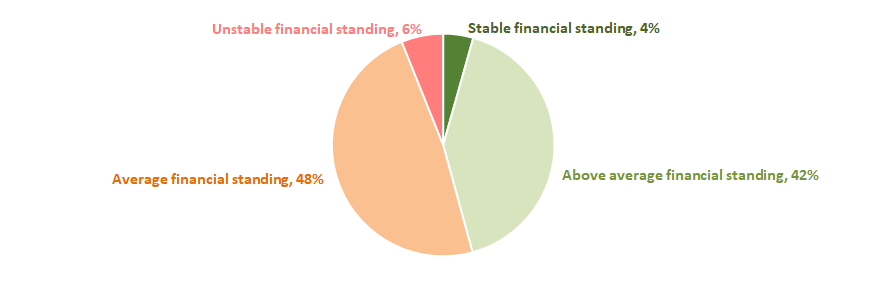 Рicture 16. TOP-5000 companies of the Northwestern Federal District by Financial position score
Liquidity index
There is a maximum or above average risk of bankruptcy in the short term for over a fifth of companies of the sector within the Northwestern Federal District (Picture 17).
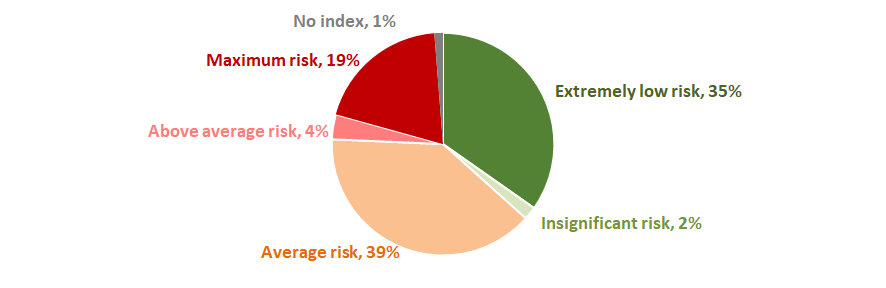 Picture 17. TOP-5000 companies of the Northwestern Federal District by Liquidity index
Solvency index Globas
The most companies of the sector out of the largest 5000 ones within the Northwestern Federal District have got a superior, high, strong and medium Solvency index Globas (Picture 18).
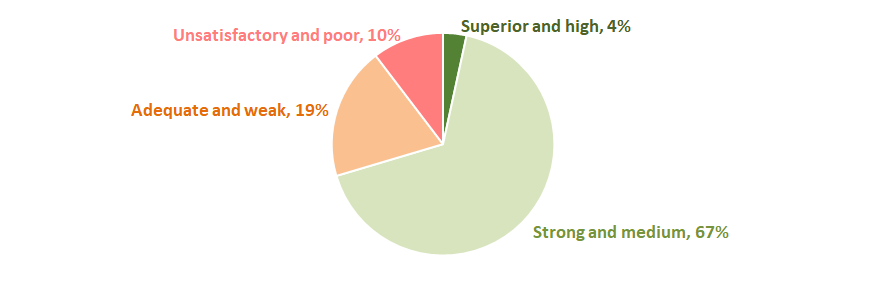 Picture 18. TOP-5000 companies of the Northwestern Federal District by Solvency index Globas
 Therefore, a comprehensive assessment of residential and non-residential construction companies of the Northwestern Federal District that considers key indexes, financial figures and ratios, is indicative of adverse trends in the sector. However, the circumstances started to stabilize in 2016.